One particular element of computer science that has seen a large evolution is the programming language section, which is an integral part of machines and comprises instructions that allow the machines to perform different tasks. Python is one high-level programming language that has immensely grown and is being used in multiple sectors of the industry.
However, Python itself is vast and can be implemented in several different flavors, which shall also be the topic of our discussion in this article, and where we will be looking at the different implementations that currently exist of Python.
Different Implementations of Python
We have been using the term “implementation” for a while now. What does this mean? Well, implementation refers to the way the interpreter was written – what languages were used and what is the purpose of that specific interpreter.
Now, let us look at some of the different implementations of Python.
1) CPython
CPython is the default and most widely used interpreter or implementation of Python, written in C. It is the original Python version, which users download from its official website, Python.org. It can be better described as a mixture of both an interpreter and compiler as it converts your written Python source code into bytecode. By bytecode, we refer to a program code that gets compiled and processed into a low-level language that can be used as instructions for the interpreter. It is this bytecode that gets executed on the CPython Virtual Machine.
Since it is the original Python implementation, CPython has the highest compatibility with a variety of Python packages and modules and is the best choice if users need to write code that completely matches the Python standards.
2) Jython
Jython is another Python implementation that has been written in the Java language whose implementation can run in Java platforms. Similar to CPython, it first converts the source code into bytecode, which, as mentioned before, are a set of instructions that are needed by an interpreter. In Jython, these are written in Java and can run on the Java Virtual Machine, which is the same environment that Java itself uses. Jython allows users to easily work with Java programs since you can call, as well as utilize, your Java functions and classes directly from Jython without any additional effort which is immensely beneficial as Python users can get access into the enormous ecosystem of libraries and frameworks that come along with Java. The same is true on the opposite end.
3) IronPython
Similar to how Jython has been developed for Java users, IronPython is the popular Python implementation that has been written in C-Sharp (C#) and has been designed to run on the .NET platform. It creates a bridge between the Python and .NET universe and allows Python users to get access to C-sharp functions and classes, as well as .NET libraries and frameworks directly from IronPython. IronPython excels for programs that make use of threading and can be found on the ironpython.net website.
4) PyPy
PyPy is the Python implementation that has been written in the Python language itself and is another alternative to CPython. Since it has been created while keeping in mind the specifications of the Python language, it is most compatible with CPython, allowing it to run web frameworks like Django and Flask, and even adds a few improvements on the top of it. PyPy makes use of the concept called Just-in-time (JIT) compilation, which allows it to compile the source code during the execution of the program. This, in turn, has made it several times faster than CPython, in which its runtime speed being slow was a common complaint among users. PyPy completely improves this part of CPython.
5) Cython
Unlike the other implementations of Python mentioned in the list, Cython is not a Python interpreter but rather a superset of the Python language that allows users to compile programs in the C language. The amazing thing is that it provides you with the combined power of both Python and C, and this, therefore, is why it can be used for writing C extensions as well as transform and tune your Python code into C. Hence, Cython overcomes many limitations of Python and still maintains the convenience and comfort that comes with Python.
Conclusion:
Python has enormously grown and expanded into various implementations, all of which have been developed to the cater the needs of different users. Throughout the time frame in which users might be working with the Python interface, they might come across several of these implementations, and therefore, it is important to know what exactly each of these is and where does their expertise lie.
]]>Different parts of Django Logging
Django logging contains four types of configurations which are explained below.
1. Django Logger
The logger records the events when the application is executed, and the logging is called. The log entries are stored in a file by categorizing them in different log levels. Every log level indicates the severity of the events. The purposes of these log levels are mentioned below:
- DEBUG
It provides low-level system information for debugging.
- INFO
It provides general information.
- ERROR
It provides information about the major problem of the application.
- WARNING
It provides information about the minor problem of the application.
- CRITICAL
It provides information about the critical problem of the application.
2. Django Handler
The main task of the handler is to transmit the log information that is stored in the log file. The logging module contains many types of handlers and multiple of them can be defined for the same logger.
3. Django Formatter
It is used to format the log data. The data of the handler cannot be sent directly to the log file and the handler data requires it to be converted by using the formatter before sending. The formatter converts the log records into the string. The format of the data depends on the business logic of the handler.
4. Django Filter
It is used to filter the log messages. It is unnecessary to store all log messages into the log file. Different handlers can be used for different messages and the required log messages can be filtered using the required filters.
Prerequisites
Before practicing the script of this tutorial, you must complete the following tasks:
- Install the Django version 3+ on Ubuntu 20+ (preferably)
- Create a Django project
- Run the Django server to check the server is working properly or not.
Setup a Django app
- Run the following command to create a Django app named logapp.
- Run the following command to create the user for accessing the Django database. If you have created the user before then don’t need to run the command.
- Add the app name in the INSTALLED_APP part of the py file.
…..
'logapp'
]
Set the Logging Information in settings.py
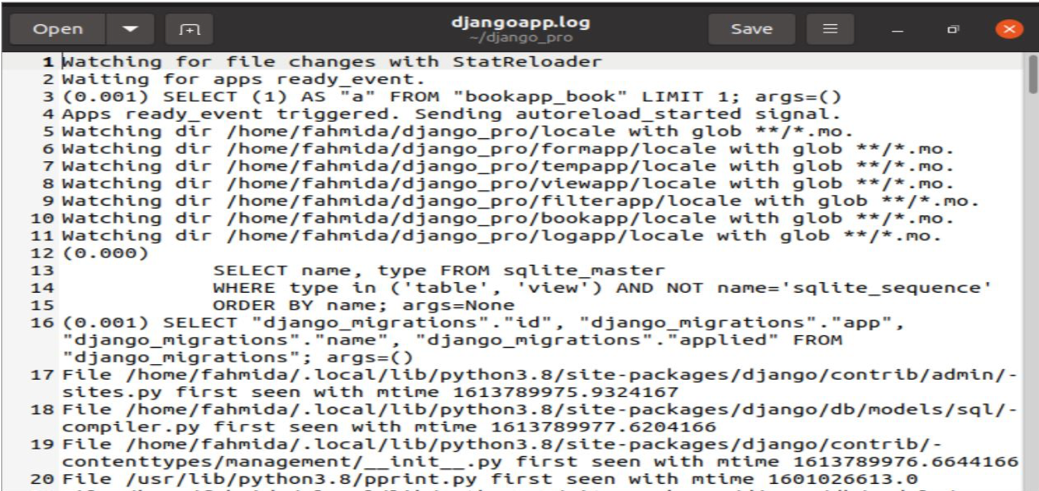
Open the settings.py file from the Django project folder and add the following content to define the logging information. The properties of the handlers and loggers are set here. According to the logging property values, DEBUG level logging information will be stored in a log file named djangoapp.log when the Django app will be executed.
LOGGING = {
# Define the logging version
'version': 1,
# Enable the existing loggers
'disable_existing_loggers': False,
# Define the handlers
'handlers': {
'file': {
'level': 'DEBUG',
'class': 'logging.FileHandler',
'filename': 'djangoapp.log',
},
'console': {
'class': 'logging.StreamHandler',
},
},
# Define the loggers
'loggers': {
'django': {
'handlers': ['file'],
'level': 'DEBUG',
'propagate': True,
},
},
}
Open the djangoapp.log file to check log entries are stored in the file or not.
Set the Logging Information in views.py
Logging information can be defined using the view file also. Open the views.py file from the logapp folder and replace the content with the following script. In this script, formatters, handlers, and loggers parts of Django logging are defined in the config.dictConfig() method. DEBUG level logging information will be stored in a log file named djangoapp.log and will be printed in the console when the Django app will be executed. index() function is used to send a simple headline text to the browser and the display_log() function is defined to send a simple text in the terminal and a headline text to the browser.
views.py
import logging
# Import HttpResponse to send data to the browser
from django.http import HttpResponse
# Define the logging configurations
logging.config.dictConfig({
# Define the logging version
'version': 1,
# Enable the existing loggers
'disable_existing_loggers': False,
# Define the formatters
'formatters': {
'console': {
'format': '%(message)s'
},
'file': {
'format': '%(message)s'
},
# Define the handlers
'handlers': {
'console': {
'class': 'logging.StreamHandler',
'formatter': 'console'
},
'file': {
'level': 'DEBUG',
'class': 'logging.FileHandler',
'formatter': 'file',
'filename': 'djangoapp.log'
}
},
# Define the loggers
'loggers': {
'django': {
'level': 'DEBUG',
'handlers': ['file', 'console'],
}
}
}
})
# Create the loggers object
logger = logging.getLogger('__name__')
# Define the function for the index page
def index(request):
return HttpResponse("<h1 style='color:blue'>This is a Django Application</h1>")
# Define the function for the log page
def display_log(request):
# Send the Test!! log message to standard out
logger.error("Testing Django log...")
return HttpResponse("<h1 style='color:Red'>Django Logging Message</h1>")
Modify the content of the urls.py file with the following script. In the script, the empty path(”) path is defined to call the index() function of the views and the ‘log/’ path is used to call the display_log() function of the views.
urls.py
from logapp import views
urlpatterns = [
path('', views.index),
path('log/', views.display_log)
]
Run the following URL to display the index page.

Run the following URL to call the display_log() method that will display a text message in the browser and a text message in the terminal. Log entries will be appended in the djangoapp.log file.


Conclusion
Two ways of using python logging in the Django application to keep the DEBUG level logging information are shown in this tutorial. The basic concept regarding Django logging is expected to be understood by the readers after reading this tutorial.
]]>Prerequisites
Before practicing the examples of this tutorial, you must complete the following tasks:
- Install the Django version 3+ on Ubuntu 20+ (preferably)
- Create a Django project
- Run the Django server to check the server is working properly or not.
Setup a Django App
A. Run the following command to create a Django app named filterapp.
B. Run the following command to create the user for accessing the Django database. If you have created the user before then don’t need to run the command.
C. Add the app name in the INSTALLED_APP part of the py file.
…..
'filterapp'
]
D. Create a folder named templates inside the filterapp folder and set the template’s location of the app in the TEMPLATES part of the py file.
{
….
'DIRS': ['/home/fahmida/django_pro/filterapp/templates'],
….
},
]
Create a Model for the Database Table
Open the models.py file from the filterapp folder and add the following script to define the structure of employees tables. Employee class is defined to create a table named employees with name, post, email, department, and joining_date fields. Here, name, post, and department fields will store character data, the email field will store the email address and the joining_date field will store date data.
models.py
from django.db import models
# Define class to create employees table
class Employee(models.Model):
name = models.CharField(max_length=50)
post = models.CharField(max_length=40)
email = models.EmailField()
department = models.CharField(max_length=30)
joinning_date = models.DateField()
Run the makemigrations command to create a new migration based on the changes made by the models.
Run the migrate command to execute the SQL commands and create all tables in the database that are defined in the models.py file.
Modify the content of the admin.py file with the following content. Here, the Employee class of the models is registered using the register() method to display the records of employees tables in the Django administration dashboard.
admin.py
from django.contrib import admin
# Import Employee model
from .models import Employee
# Register employee model
admin.site.register(Employee)
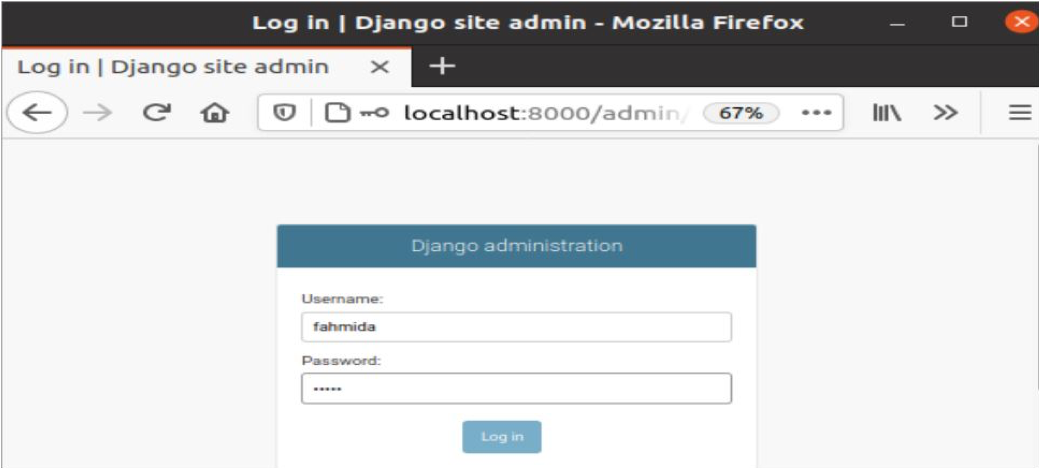
Run the following URL to open the Django admin login page. Provide the valid username and password to open the Django Administration Dashboard to access the database tables.
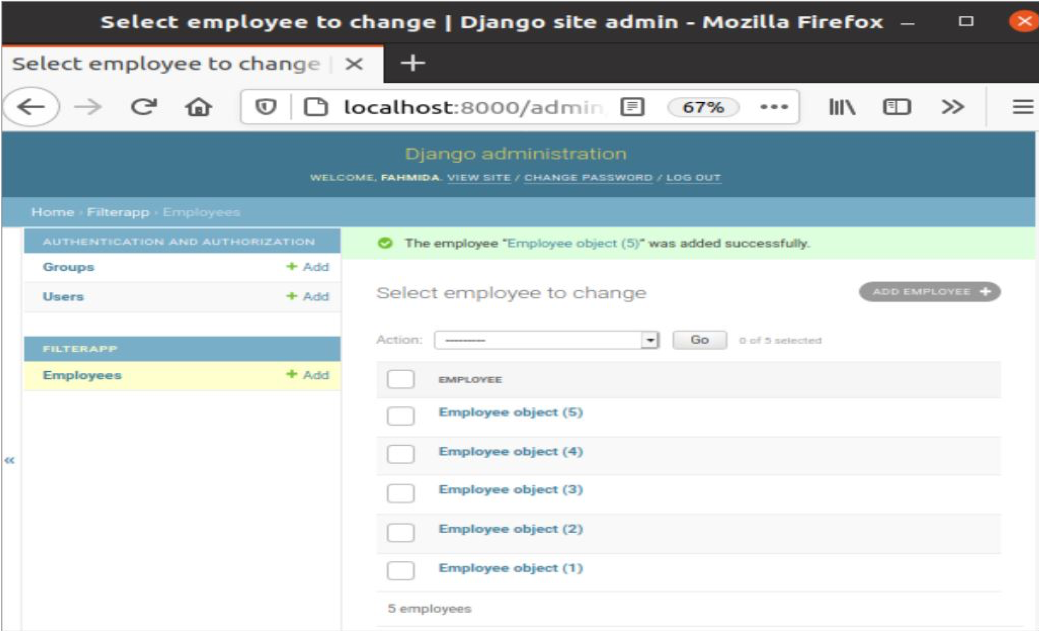
Insert two or more Employee records to apply the filter on the data. Here five records are inserted.
Create the search.html file inside the filterapp/templates/ folder with the following script. The data from the employee table will be displayed in this template file. for loop is used to read the content of the object_list variable that will be passed from the view file. The name, post, and department values of the employees table will be displayed by using the list.
search.html
Open the views.py file from the filterapp folder and modify the content of the file with the following script. Model and template names are defined in the script.
views.py
from django.views.generic import ListView
# Import Employee module
from .models import Employee
# Import Q module
from django.db.models import Q
# Define class for filtering data
class SearchEmployee(ListView):
# Define model
model = Employee
# Define template
template_name = 'search.html'
Modify the content of the urls.py file with the following content. In the script, the ‘searchEmp’ path is defined to call the SearchEmployee.as_view() method that will send all data and the filtered data of the employees table to the template file.
urls.py
from django.contrib import admin
# Import path and include module
from django.urls import path, include
# Import SearchEmployee module
from filterapp.views import SearchEmployee
urlpatterns = [
# Define the path for admin
path('admin/', admin.site.urls),
# Define the path for search
path('searchEmp/', SearchEmployee.as_view()),
]
The following output will appear without applying any filtering for the following URL.
http://localhost:8000/SerachEmp

Filter Data by Simple Filtering
Add the following line at the end of the views.py file to filter the records of the employees table where the value of the post field is ‘Accountant’.
queryset = Employee.objects.filter(post ='Accountant')
The following output will appear after applying basic filtering.

Filter Data with Multiple Fields
Add the following line at the end of the views.py file to filter the records of the employees table where the value of the department field is ‘HT’ and the email field is ‘[email protected]’.
queryset = Employee.objects.filter(department='HR', email='[email protected]')
The following output will appear after applying multiple filtering.

Filter Data with Q Object
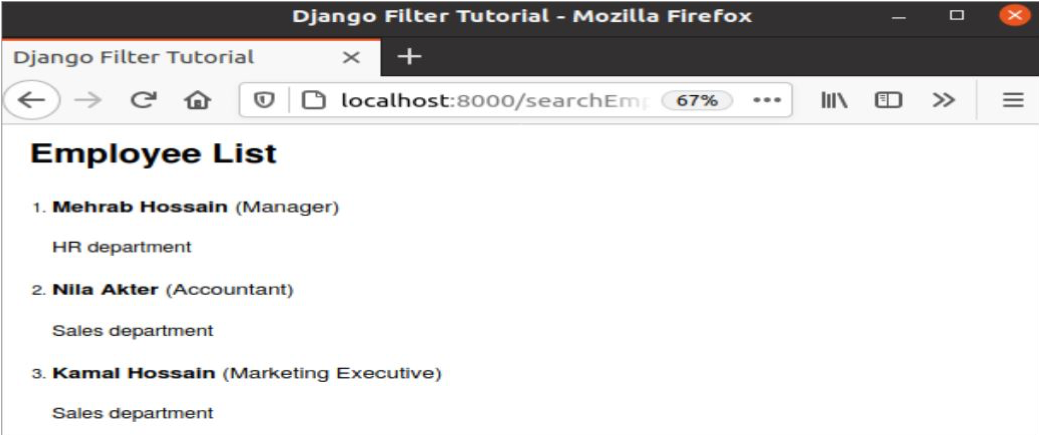
Add the following line at the end of the views.py file to filter the records of the employees table where the value of the post field is ‘Manager’ or the value of the department field is ‘Sales’.
queryset = Employee.objects.filter( Q(post='Manager') | Q(department='Sales'))
The following output will appear after applying Q object filtering.
Filter Data by Using Filter Chaining
Add the following line at the end of the views.py file to filter the records of the employees table where the value of the department field will be checked first and if it returns true then the value of the name field will be checked.
queryset = Employee.objects.filter(department='HR').filter(name='Mehrab Hossain')
The following output will appear after applying filter chaining.

Conclusion
The data can be filtered in Django in many ways based on the application requirements. Four different ways of filtering were explained in this tutorial to understand the basics of Django filtering. These are simple filtering, multiple filtering, filtering with Q object, and filter chaining.
]]>How the Django template can be created and how the DTL can be used to add static or dynamic content to the template have been shown in this tutorial.
Advantages of using DTL:
There are many benefits of using DTL in Django templates. Some of them are mentioned below.
- The logical part and the presentational part of the application are created separately.
- It becomes easier to extend the application.
- It helps reduce the redundancy of the data.
- It assures the application’s security.
Prerequisites:
Before practicing the script of this tutorial, you have to complete the following tasks:
- Install the Django version 3+ on Ubuntu 20+ (preferably)
- Create a Django project
- Run the Django server to check whether the server is working properly or not
Setup a Django app:
Run the following command to create a Django app named tempapp:
Run the following command to create the user for accessing the Django database, but if you have created the user before, then don’t need to run the command shown below:
Add the app name in the INSTALLED_APP part of the settings.py file, as shown below:
…..
'tempapp'
]
Create a folder named templates inside the tempapp folder and set the template’s location of the app in the TEMPLATES part of the settings.py file, as shown below:
{
….
'DIRS': ['/home/fahmida/django_pro/tempapp/templates'],
….
},
]
Create a Simple Django Template:
Create the index.html file inside the tempapp/templates/ folder with the following HTML script to display the formatted static text of two lines in the browser. HTML file can’t be displayed directly in the browser and the views.py file is used to render the HTML file in the Django application.
index.html
<html lang="en">
<head>
<meta charset="UTF-8">
<title>Django Tutorials</title>
</head>
<body>
<center>
<h1 style="color:blue">Learn Django Template Language</h1>
<p style="font-size:20px; color:red">Django is popular python framework to design web application</p>
</center>
</body>
</html>
Open the views.py file from tempapp folder and add the following script. The rander() method is used in the views.py file to display any template file into the browser.
In the following script, the index() function is defined to display the content of the index.html file. When this function call from the urls.py file, then the template file will be displayed in the browser.
views.py
from django.shortcuts import render
# Create index function to display the HTML file into the browser
def index(request):
return render(request, "index.html")
Modify the content of the urls.py file with the following script. According to the script, the index() function of the views.py will be called for the path, ‘index/’.
urls.py
from django.urls import path
# Import views
from tempapp import views
# Define method for index path
urlpatterns = [
path('index/', views.index)python3 manage.py createsuperuser
]
Run the following URL from the browser to get the following output. The static data is displayed in the output.
http://localhost:8000/index/

Create a Django Template with DTL:
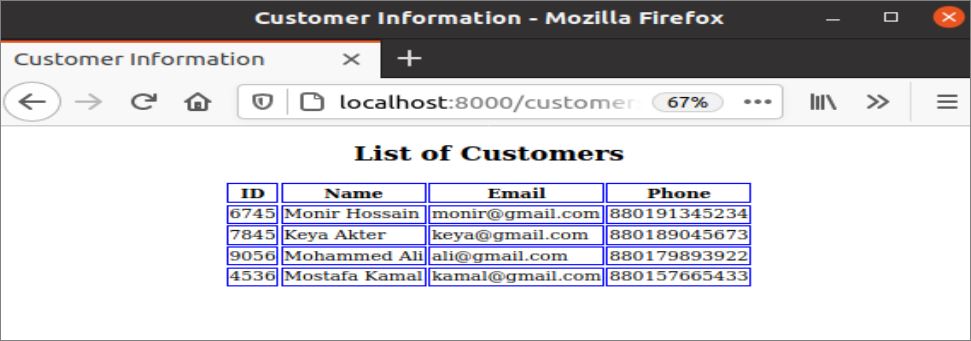
Create the customers.html file inside the tempapp/templates/ folder with the following HTML script. DTL is used in this script to display the data of the dictionary variable that is initialized by the data of nested lists in the views2.py file. The first for loop is used to read the values of the outer list and the second for loop is used to read the values of the inner list.
customers.html
<html lang="en">
<head>
<meta charset="UTF-8">
<title>Customer Information</title>
<style>
.table, th, tr, td{
border:1px solid blue;
}
</style>
</head>
<body>
<center>
<h2>List of Customers</h2>
<table>
<tr>
<th>ID</th><th>Name</th><th>Email</th><th>Phone</th>
</tr>
{% for rows in customers %}
<tr>
{% for col in rows %}
<td>{{ col }}</td>
{% endfor %}
</tr>
{% endfor %}
</table>
</center>
</body>
</html>
Create another view file named views2.py under tempapp folder with the following script. A dictionary variable named data is declared in the script that contains a nested list to generate tabular data of 4 rows and 4 columns. The data variable will be sent to the template when the customers() function of this script will be called from the urls.py file.
views2.py
from django.shortcuts import render
# create a function to send tabular data to template
def customers(request):
# define a dictionary of nested list
data = {"customers": [['6745', 'Monir Hossain', '[email protected]', '880191345234'],
['7845', 'Keya Akter', '[email protected]', '880189045673'],
['9056', 'Mohammed Ali', '[email protected]', '880179893922'],
['4536', 'Mostafa Kamal', '[email protected]', '880157665433']]
}
# return response with template and data
return render(request, "customers.html", data)
Modify the urls.py file with the following script. ‘customers/’ path is defined in the script to load the customers.html file in the browser with the data of the dictionary.
urls.py
from django.urls import path
# Import views
from tempapp import views
# Import views2
from tempapp import views2
# Define methods for index and customers paths
urlpatterns = [
path('index/', views.index),
path('customers/', views2.customers)
]
Run the following URL from the browser to get the following output. The records of all customers from the database tables have been displayed in the browser using the DTL.
http://localhost:8000/customers/
Conclusion:
The ways of creating a simple template and a template with Django Template Language (DTL) have been shown in this tutorial. The new Django users will be able to create the template for the Django app properly after practicing the script of this tutorial.
]]>How HTML form can be used to take data from the user, read the input values, and print the values in the browser using Django is shown in this tutorial.
Prerequisites:
You have to create a Django project before creating the Django form. To create a new Django project and go to the project folder, run the following commands:
$ cd django_pro
To create necessary files and apply migrations for the project, run the following command:
To check if the Django server is working properly or not, run the following command:
To create the formapp under django_pro project, run the following command:
Create HTML Form Using Django:
Open the views.py file that is inside formapp folder and modify its content with the following content. The following script will check whether the form is submitted or not. If the form is submitted then the value of the request.method will be POST and request.POST.get() method is used to read its submitted values. The is_valid() function will check whether the data of the form is valid or not. If this function returns true, then a success message with the valid user’s data will be printed in the browser, otherwise, the error message that appears on the particular field of the form will be displayed. Other than that, the render() method is used to load the form in the browser and HttpResponse() method is used to send the response from the server to the browser after submitting the form.
from django.shortcuts import render
from formapp.forms import StudentForm
from django.http import HttpResponse
def form_request(request):
# Check the form is submitted or not
if request.method == 'POST':
student = StudentForm(request.POST)
# Check the form data are valid or not
if student.is_valid():
# Read the submitted values
name = request.POST.get("name")
email = request.POST.get("email")
username = request.POST.get("username")
# Merge the values
data = ['Your registration is completed successfully.<br />', 'Name:', name, '<br />', 'Email:', email, '<br />', 'Username:', username]
# Return the form values as response
return HttpResponse(data)
else:
# Display the html form
student = StudentForm()
return render(request, "form.html", {'form': student})
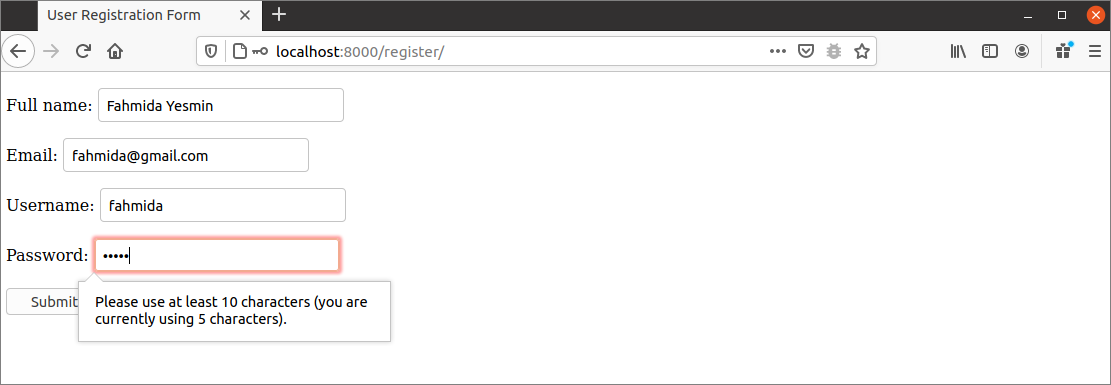
Create forms.py inside the formapp folder and add the following content. The following script will create a form of four fields. The name field is defined to take the character data and it can be 40 characters long. The email field is defined to take any valid email address using the character data and it can be 50 characters long. The username field is defined to take the character data, and it can be 20 characters long. The password field is defined to take the character data and it can be a minimum of 10 characters and a maximum of 20 characters long. The forms.PasswordInput widget is used for the password field to hide the content of the password field.
from django import forms
# Create class to define the form fields
class StudentForm(forms.Form):
name = forms.CharField(label="Full name", max_length=40)
email = forms.EmailField(label="Email", max_length=50)
username = forms.CharField(label="Username", max_length=20)
password = forms.CharField(label="Password", min_length=10, max_length=20, widget=forms.PasswordInput)
Create a folder named templates inside the formapp folder. Go to the TEMPLATES section of the settings.py file and set the location of the template folder for the DIRS property.
settings.py
{
'DIRS': ['/home/fahmida/django_pro/formapp/templates']
},
]
Create form.html inside the template folder with the following content.
{% csrf_token %} is used in the HTML script to prevent CSRF(Cross-Site Request Forgeries) attacks. {{ form.as_p }} will load the Django form that is designed by the forms.py file. When the Submit button is pressed, the form data will be submitted to the server.
Open the urls.py from the django_pro folder and modify the content with the following content.
Here, the ‘register/’ path is used to load the form in the browser.
from django.urls import path
from formapp import views
# Call method to display the form
urlpatterns = [
path('register/', views.form_request)
]
Open any browser and type the following URL to load the user registration form in the browser.
http://localhost:8000/register
The following output will appear after running the URL. The validation for the empty field, the maximum length value of name, email, and password fields, and the minimum and maximum length values of the password field will be checked after submitting the form.

The following output shows that the password field is invalid. According to the form, the length of the password value must be within 10 to 20 characters. 5 characters have been given as input in the following form. For this, the form is showing the error message.
After entering the valid output in every field of the form, the following output will appear.

Conclusion:
The way of creating a very simple user registration form in the Django application has been shown in this tutorial. Django has many methods for creating different types of fields of the form, such as CharField(), EmailField(), TextFiled, etc. The form validation task becomes very easier when the form is designed by Django form.
]]>Django framework can be used to create a web application with a database by writing script in models.py and views.py files of the Django app. The data can be inserted into the database tables by using Django Administration Dashboard or by writing a script in the views.py file. Django Administration Dashboard requires a login for an authenticated user to access the tables of the database. Single or multiple records can be inserted into the database tables by writing a script. bulk_create() method is one of the ways to insert multiple records in the database table. How the bulk_create() method is used to insert the multiple data in a Django database table will be shown in this tutorial.
Prerequisites:
Before practicing the script of this tutorial, you have to complete the following tasks:
- Install the Django version 3+ on Ubuntu 20+ (preferably)
- Create a Django project
- Run the Django server to check the server is working properly or not
Setup a Django app:
Run the following command to create a Django app named bookapp.
Run the following command to create the user to access the Django database. If you already created one, then you don’t need to run the command.
Add the app name in the INSTALLED_APP part of the settings.py file.
…..
'bookapp'
]
Create a folder named templates inside the bookapp folder and set the template’s location of the app in the TEMPLATES part of the settings.py file.
{
….
'DIRS': ['/home/fahmida/django_pro/bookapp/templates'],
….
},
]
Create a model for the database table:
Open the models.py file from the bookapp folder and add the following script to define the structure of books tables. Book class is defined to create a table named books with title, author, price, and published_year fields. According to the script, title and author fields will store character data, and price and published_year fields will store the integer data. Here, the title field is defined with the unique attribute. That means that the value of the title field will not accept any duplicate data.
models.py
from django.db import models
# Define the Book class for the books table
class Book(models.Model):
title = models.CharField(max_length=100, unique=True)
author = models.CharField(max_length=100)
price = models.IntegerField()
published_year = models.IntegerField()
Run the makemigrations command to create a new migration based on the changes made by the models.
Run the migrate command to execute the SQL commands and create all tables in the database that are defined in the models.py file.
Modify the content of the admin.py file with the following content. Here, the Book class of the models is registered using the register() method to display the books tables in the Django administration dashboard.
admin.py
from django.contrib import admin
# Import Book model
from .models import Book
# Register Book model
admin.site.register(Book)
Create a template file named DisplayBookList.html inside the bookapp/templates/ folder with the following script. This script will display all data of books table in tabular form. Other than that, for loop is used in the script to iterate the data passed from the views.py file.
DisplayBookList.html
<head>
<title>
Django bulk_create() Tutorial
</title>
<style>
th { text-align:left; }
table, th, td { border: 1px solid;}
h1{ color:Blue;}
#name{ width:350px;}
</style>
</head>
<body>
<center><h1 style="margin-left:20px;">Python Book List</h1></center>
<center>
<table>
<tr>
<th>ID</th><th id="name">Name</th><th>Author</th><th>Publication Year</th><th>Price</th>
</tr>
{% for book in object_list %}
<tr>
<td>{{book.id}} </td> <td>{{book.title}}</td> <td>{{book.author}}</td><td>{{book.published_year}}</td><td style="text-align:right">${{book.price}}</td>
</tr>
{% endfor %}
</table>
</center>
</body>
</html>
Modify the content of the views.py file with the following script. The model and template names are defined in the BulkInsert class. get_queryset() method of the class is defined in the script to return all records of the books table. On the other hand, Book.objects.all() method is used to return all records of the books table. exists() method is used in the script to check the books table is empty or not. If this method returns False then five records will be inserted into the books table using the bulk_create() method.
views.py
# Import ListView module
from django.views.generic import ListView
# Import Book model
from .models import Book
# Define class for inserting multiple data
class BulkInsert(ListView):
# Define model
model = Book
# Define template
template_name = 'DisplayBookList.html'
# Read all existing records of books table
queryset = Book.objects.all()
# Check the books table is empty or not
if queryset.exists() == False:
# Insert 5 records in the books table at a time
Book.objects.bulk_create([
Book(title='Python Crash Course, 2nd Edition', author='Eric Matthes', price=15, published_year=2019),
Book(title='Automate the Boring Stuff with Python, 2nd Edition', author='Al Sweigart', price=30,
published_year=2019),
Book(title='Learning Python', author='Mark Lutz', price=15, published_year=2019),
Book(title='Head First Python', author='Paul Barry', price=45, published_year=2016),
Book(title='A Byte of Python', author='Swaroop C H', price=15, published_year=2013),
])
# Return all records of the books table
def get_queryset(self):
# Set the default query set
return Book.objects.all()
Modify the content of the urls.py file with the following script. In the script, the ‘admin/’ path is defined to open the Django Administration Dashboard and the ‘books/’ path is defined to call the BulkInsert.as_view() method that will insert five records to the books table and return the records to the template file.
urls.py
from django.contrib import admin
# Import path and include module
from django.urls import path
from bookapp import views
urlpatterns = [
# Define the path for admin
path('admin/', admin.site.urls),
path('books/', views.BulkInsert.as_view()),
]
Open the Django Administration Dashboard to check whether the data is inserted properly or not using the bulk_create() function.

The inserted records of the books table will be displayed in the browser after executing the following URL.

Conclusion:
Multiple records can be inserted into the Django database table in different ways using the bulk_create(). A simple way of inserting multiple records in the database table using this method was shown in this tutorial to help Django users understand the logic behind the process.
]]>Prerequisites
Before practicing the script shown in this tutorial, be sure to complete the following tasks.
- Install Django version 3+ on Ubuntu 20+ (preferably)
- Create a Django project
- Run the Django server to check whether the server is working properly
Set Up a Django App
Run the following command to create a Django app named socketapp:
Run the following command to install the channel:
Add the channels and app name to the INSTALLED_APP part of the settings.py file:
…..
'channels',
'socketapp'
]
Define the value of ASGI_APPLICATION in the settings.py file:
Create a folder named templates inside the socketapp folder and set the template’s location of the app in the TEMPLATES part of the settings.py file:
{
….
'DIRS': ['/home/fahmida/channel_pro/socketapp/templates'],
….
},
]
The following output will appear in the terminal after running the Django server. The output shows that ASGI/Channels version 3.0.3 is running.

Create a template file named index.html in the defined template location to display the data sent by the WebSocket. The socket object that is created using JavaScript will read the data using the JSON.parse() method, then pass the value into the content of the <h1> tag that contains the ID value, ‘msg.’
index.html
<html lang="en">
<head>
<meta charset="UTF-8">
<title>Django Channel Tutorials</title>
<script>
socket = new WebSocket("ws://localhost:8000/msg/");
socket.onmessage = function(e) {
var data = JSON.parse(e.data);
document.querySelector('#msg').innerText = data.timeValue;
}
</script>
</head>
<body>
<center>
<h1 style="color:blue" id ="msg">{{ text }}</h1>
</center>
</body>
</html>
Modify the views.py file of the socketapp with the following content. The index.html template file will be displayed in the browser with the text variable when the index() method of this script is called from the urls.py file. If no message is transmitted from the socket, then the text ‘LinuxHint’ will be displayed in the browser.
views.py
from django.shortcuts import render
# Create index function to display the HTML file into the browser
def index(request):
return render(request, "index.html", context={'text': 'LinuxHint'})
Modify the urls.py file of the socketapp with the following content. Two paths are defined in the script: the ‘admin/’ path is used to open the Django Administration Dashboard, and the ‘msg/‘ path is used to read the WebSocket message.
urls.py
from django.urls import path
from socketapp import views
urlpatterns = [
path('admin/', admin.site.urls),
path('msg/', views.index)
]
When the following URL is executed without defining the consumer and routing files, the HTTP protocol will work and the following output will appear.

Now, create a consumers.py file inside the socketapp folder with the following script. The connect() method of ws_consumer will be used to accept the socket connection, read the current time value every second, and send the current time in JSON format via WebSocket when this method is called from the routing file.
consumers.py
import json
# Import WebsocketConsumer
from channels.generic.websocket import WebsocketConsumer
# Import datetime module
from datetime import datetime
# Import sleep module
from time import sleep
# Define the consumer class to send the data through WebsocketConsumer
class ws_consumer(WebsocketConsumer):
def connect(self):
self.accept()
while(True):
now = datetime.now()
self.send(json.dumps({'timeValue': now.strftime("%H:%M:%S")}))
sleep(1)
Create the routing.py inside the socketapp folder with the following script. The ‘msg/’ path is defined in the script to call the consumer for sending the data to the socket.
routing.py
from .consumers import ws_consumer
# Set the path to call the consumer
ws_urlpatterns = [
path('msg/', ws_consumer.as_asgi())
]
Modify the asgi.py file with the following script. The modules that are required to handle HTTP and WebSocket requests are imported in the script.
asgi.py
import os
# Import get_asgi_application to handle http protocol
from django.core.asgi import get_asgi_application
# Import ProtocolTypeRouter and URLRouter to set the websocket routing
from channels.routing import ProtocolTypeRouter, URLRouter
# Import AuthMiddlewareStack to handle websocket
from channels.auth import AuthMiddlewareStack
# Import websocket routing
from socketapp.routing import ws_urlpatterns
# Assign value for DJANGO_SETTINGS_MODULE
os.environ.setdefault('DJANGO_SETTINGS_MODULE', 'channel_pro.settings')
# Define application variable to handle http and websocket
application = ProtocolTypeRouter({
'http': get_asgi_application(),
'websocket': AuthMiddlewareStack(URLRouter(ws_urlpatterns))
})
Now, run the following URL from the browser again to read the data from the WebSocket.
If the consumer and router are working properly, then the following digital clock will be displayed in the browser. Here, the router has sent the WebSocket request using the ‘msg/‘ path to the consumer that has accepted the request and sent the data to the template to show the digital clock in the browser where the second value of the current time is updating every second.

Conclusion
This tutorial showed you how to implement a real-time application using the Django framework and channels by creating a simple digital clock. Other types of real-time applications can also be implemented using Django and channels, such as online chatting systems. The scripts used in this tutorial work for Django versions 3+ and Channel versions 3+ only. So, if you are using an earlier Django or Channel version, then you will need to upgrade the version before testing the script provided in this tutorial.
]]>In this article, we will explore various data plotting methods by using the Pandas python. We have executed all examples on the pycharm source code editor by using the matplotlib.pyplot package.
Plotting in Pandas Python
In Pandas, the .plot() has several parameters that you can use based on your needs. Mostly, using the ‘kind’ parameter, you can define which type of plot you will create.
The Syntax for Plotting Data using Pandas Python
The following syntax is used to plot a DataFrame in Pandas Python:
import pandas as pd
import matplotlib.pyplot as plt
# Prepare Data to create DataFrame
data_frame = {
'Column1': ['field1', 'field2', 'field3', 'field4',...],
‘Column2': ['field1', 'field2', 'field3', 'field4',...]
}
var_df= pd.DataFrame(data_frame, columns=['Column1', 'Column2])
print(Variable)
# plotting bar graph
var_df.plot.bar(x='Column1', y='Column2')
plt.show()
You can also define the plot kind by using the kind parameter as follows:
Pandas DataFrames objects have the following plot methods for plotting:
- Scatter Plotting: plot.scatter()
- Bar Plotting: plot.bar() , plot.barh() where h represents horizontal bars plot.
- Line Plotting: plot.line()
- Pie Plotting: plot.pie()
If a user only uses the plot() method without using any parameter then, it creates the default line graph.
We will now elaborate on some major types of plotting in detail with the help of some examples.
Scatter Plotting in Pandas
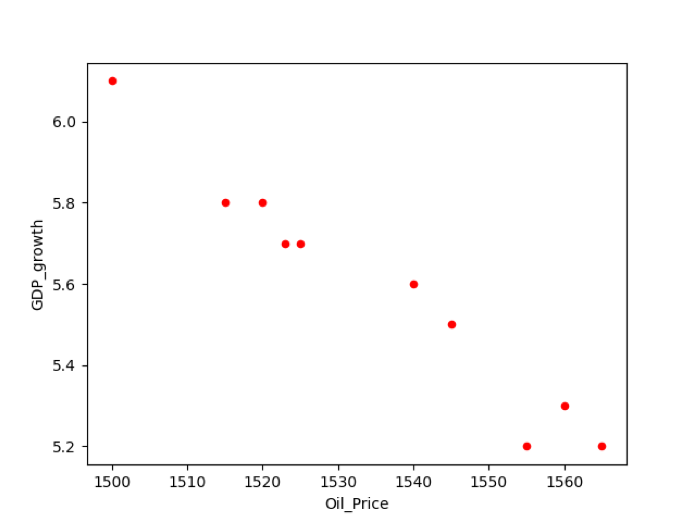
In this type of plotting, we have represented the relationship between two variables. Let’s take an example.
Example
For example, we have data of correlation between two variables GDP_growth and Oil_price. To plot the relation between two variables, we have executed the following piece of code on our source code editor:
import pandas as pd
gdp_cal= pd.DataFrame({
'GDP_growth': [6.1, 5.8, 5.7, 5.7, 5.8, 5.6, 5.5, 5.3, 5.2, 5.2],
'Oil_Price': [1500, 1520, 1525, 1523, 1515, 1540, 1545, 1560, 1555, 1565]
})
df = pd.DataFrame(gdp_cal, columns=['Oil_Price', 'GDP_growth'])
print(df)
df.plot(x='Oil_Price', y='GDP_growth', kind = 'scatter', color= 'red')
plt.show()
Line Charts Plotting in Pandas
The line chart plot is a basic type of plotting in which given information displays in a data points series that are further connected by segments of straight lines. Using the Line charts, you can also show the trends of information overtime.
Example
In the below-mentioned example, we have taken the data about the past year’s inflation rate. First, prepare the data and then create DataFrame. The following source code plots the line graph of the available data:
import matplotlib.pyplot as plt
infl_cal = {'Year': [2001, 2002, 2003, 2004, 2005, 2006, 2007, 2008, 2009, 2010, 2011],
'Infl_Rate': [5.8, 10, 7, 6.7, 6.8, 6, 5.5, 8.2, 8.5, 9, 10]
}
data_frame = pd.DataFrame(infl_cal, columns=['Year', 'Infl_Rate'])
data_frame.plot(x='Year', y='Infl_Rate', kind='line')
plt.show()
In the above example, you need to set the kind= ‘line’ for line chart plotting.
Method 2# Using plot.line() method
The above example, you can also implement using the following method:
import matplotlib.pyplot as plt
inf_cal = {'Year': [2001, 2002, 2003, 2004, 2005, 2006, 2007, 2008, 2009, 2010, 2011],
'Inflation_Rate': [5.8, 10, 7, 6.7, 6.8, 6, 5.5, 8.2, 8.5, 9, 10]
}
data_frame = pd.DataFrame(inf_cal, columns=['Inflation_Rate'], index=[2001, 2002, 2003, 2004, 2005, 2006, 2007, 2008, 2009, 2010, 2011])
data_frame.plot.line()
plt.title('Inflation Rate Summary of Past 11 Years')
plt.ylabel('Inflation_Rate')
plt.xlabel('Year')
plt.show()
The following line graph will display after running the above code:
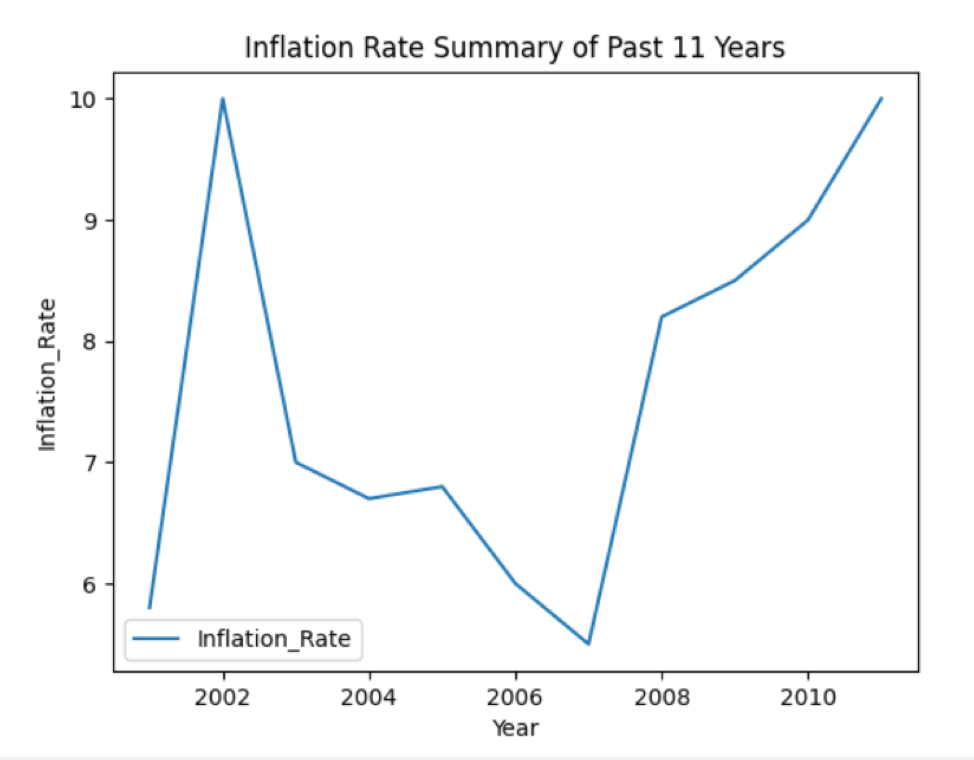
Bar Chart Plotting in Pandas
The bar chart plotting is used to represent the categorical data. In this type of plot, the rectangular bars with different heights are plotted based on the given information. The bar chart can be plotted in two different horizontal or vertical directions.
Example
We have taken the literacy rate of several countries in the following example. DataFrames are created in which ‘Country_Names’ and ‘literacy_Rate’ are the two columns of a DataFrame. Using Pandas, you can plot the information in the bar graph shape as follows:
import matplotlib.pyplot as plt
lit_cal = {
'Country_Names': ['Pakistan', 'USA', 'China', 'India', 'UK', 'Austria', 'Egypt', 'Ukraine', 'Saudia', 'Australia',
'Malaysia'],
'litr_Rate': [5.8, 10, 7, 6.7, 6.8, 6, 5.5, 8.2, 8.5, 9, 10]
}
data_frame = pd.DataFrame(lit_cal, columns=['Country_Names', 'litr_Rate'])
print(data_frame)
data_frame.plot.bar(x='Country_Names', y='litr_Rate')
plt.show()

You can also implement the above example using the following method. Set the kind=’bar’ for bar chart plotting in this line:
plt.show()
Horizontal bar chart plotting
You can also plot the data on horizontal bars by executing the following code:
import pandas as pd
data_chart = {'litr_Rate': [5.8, 10, 7, 6.7, 6.8, 6, 5.5, 8.2, 8.5, 9, 10]}
df = pd.DataFrame(data_chart, columns=['litr_Rate'], index=['Pakistan', 'USA', 'China', 'India', 'UK', 'Austria', 'Egypt', 'Ukraine', 'Saudia', 'Australia',
'Malaysia'])
df.plot.barh()
plt.title('Literacy Rate in Various Countries')
plt.ylabel('Country_Names')
plt.xlabel('litr_Rate')
plt.show()
In df.plot.barh(), the barh is used for horizontal plotting. After running the above code, the following bar chart displays on the window:

Pie Chart Plotting in Pandas
A pie chart represents the data in a circular graphic shape in which data displays into slices based on the given quantity.
Example
In the following example, we have displayed the information about ‘Earth_material’ in different slices on the Pie chart. First, create the DataFrame, then, by using the pandas, display all details on the graph.
import matplotlib.pyplot as plt
material_per = {'Earth_Part': [71,18,7,4]}
dataframe = pd.DataFrame(material_per,columns=['Earth_Part'],index = ['Water','Mineral','Sand','Metals'])
dataframe.plot.pie(y='Earth_Part',figsize=(7, 7),autopct='%1.1f%%', startangle=90)
plt.show()
The above source code plots the pie graph of the available data:
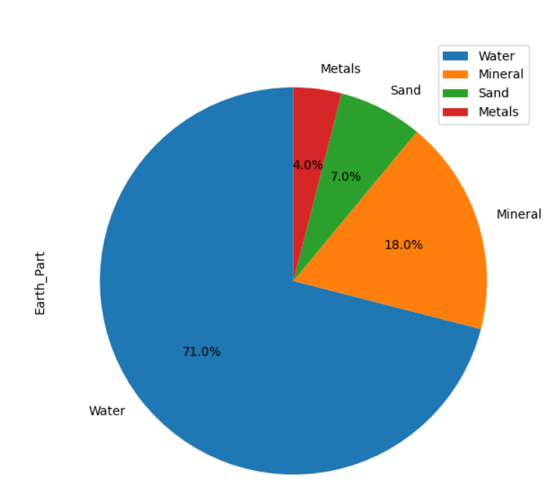
Conclusion
In this article, you have seen how to plot DataFrames in Pandas python. Different kinds of plotting are performed in the above article. To plot more kinds such as box, hexbin, hist, kde, density, area, etc., you can use the same source code just by changing the plot kind.
]]>In this article, we will walk through the basic uses of a group by function in panda’s python. All commands are executed on the Pycharm editor.
Let’s discuss the main concept of the group with the help of the employee’s data. We have created a dataframe with some useful employee details (Employee_Names, Designation, Employee_city, Age).

String Concatenation using Group by Function
Using the groupby function, you can concatenate strings. Same records can be joined with ‘,’ in a single cell.
Example
In the following example, we have sorted data based on the employees ‘Designation’ column and joined the Employees who have the same designation. The lambda function is applied on ‘Employees_Name’.
df = pd.DataFrame({
'Employee_Names':['Sam', 'Ali' , 'Umar', 'Raees', 'Mahwish', 'Hania', 'Mirha', 'Maria', 'Hamza'],
'Designation':['Manager', 'Staff', 'IT officer', 'IT officer', 'HR', 'Staff', 'HR', 'Staff', 'Team Lead'],
'Employee_city':['Karachi', 'Karachi', 'Islamabad', 'Islamabad', 'Quetta', 'Lahore', 'Faislabad', 'Lahore', 'Islamabad'],
'Employee_Age':[60, 23, 25, 32, 43, 26, 30, 23, 35]
})
df1=df.groupby("Designation")['Employee_Names'].apply(lambda Employee_Names: ','.join(Employee_Names))
print(df1)
When the above code is executed, the following output displays:
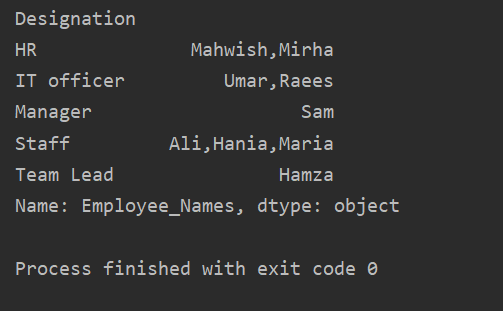
Sorting Values in an ascending order
Use the groupby object into a regular dataframe by calling ‘.to_frame()’ and then use reset_index() for reindexing. Sort column values by calling sort_values().
Example
In this example, we will sort the Employee’s age in ascending order. Using the following piece of code, we have retrieved the ‘Employee_Age’ in ascending order with ‘Employee_Names’.
df = pd.DataFrame({
'Employee_Names':['Sam', 'Ali' , 'Umar', 'Raees', 'Mahwish', 'Hania', 'Mirha', 'Maria', 'Hamza'],
'Designation':['Manager', 'Staff', 'IT officer', 'IT officer', 'HR', 'Staff', 'HR', 'Staff', 'Team Lead'],
'Employee_city':['Karachi', 'Karachi', 'Islamabad', 'Islamabad', 'Quetta', 'Lahore', 'Faislabad', 'Lahore', 'Islamabad'],
'Employee_Age':[60, 23, 25, 32, 43, 26, 30, 23, 35]
})
df1=df.groupby('Employee_Names')['Employee_Age'].sum().to_frame().reset_index().sort_values(by='Employee_Age')
print(df1)
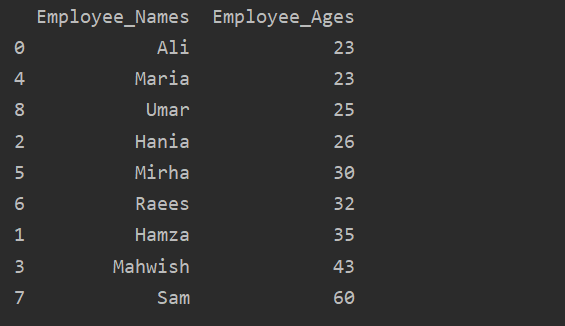
Use of aggregates with groupby
There are a number of functions or aggregations available that you can apply on data groups such as count(), sum(), mean(), median(), mode(), std(), min(), max().
Example
In this example, we have used a ‘count()’ function with groupby to count the Employees who belong to the same ‘Employee_city’.
df = pd.DataFrame({
'Employee_Names':['Sam', 'Ali' , 'Umar', 'Raees', 'Mahwish', 'Hania', 'Mirha', 'Maria', 'Hamza'],
'Designation':['Manager', 'Staff', 'IT officer', 'IT officer', 'HR', 'Staff', 'HR', 'Staff', 'Team Lead'],
'Employee_city':['Karachi', 'Karachi', 'Islamabad', 'Islamabad', 'Quetta', 'Lahore', 'Faislabad', 'Lahore', 'Islamabad'],
'Employee_Age':[60, 23, 25, 32, 43, 26, 30, 23, 35]
})
df1=df.groupby('Employee_city').count()
print(df1)
As you can see the following output, under the Designation, Employee_Names, and Employee_Age columns, count numbers that belong to the same city:

Visualize data using groupby
By using the ‘import matplotlib.pyplot’, you can visualize your data into graphs.
Example
Here, the following example visualizes the ‘Employee_Age’ with ‘Employee_Nmaes’ from the given DataFrame by using the groupby statement.
import matplotlib.pyplot as plt
dataframe = pd.DataFrame({
'Employee_Names':['Sam', 'Ali' , 'Umar', 'Raees', 'Mahwish', 'Hania', 'Mirha', 'Maria', 'Hamza'],
'Designation':['Manager', 'Staff', 'IT officer', 'IT officer', 'HR', 'Staff', 'HR', 'Staff', 'Team Lead'],
'Employee_city':['Karachi', 'Karachi', 'Islamabad', 'Islamabad', 'Quetta', 'Lahore', 'Faislabad', 'Lahore', 'Islamabad'],
'Employee_Age':[60, 23, 25, 32, 43, 26, 30, 23, 35]
})
plt.clf()
dataframe.groupby('Employee_Names').sum().plot(kind='bar')
plt.show()

Example
To plot the stacked graph using groupby, turn the ‘stacked=true’ and use the following code:
import matplotlib.pyplot as plt
df = pd.DataFrame({
'Employee_Names':['Sam', 'Ali' , 'Umar', 'Raees', 'Mahwish', 'Hania', 'Mirha', 'Maria', 'Hamza'],
'Designation':['Manager', 'Staff', 'IT officer', 'IT officer', 'HR', 'Staff', 'HR', 'Staff', 'Team Lead'],
'Employee_city':['Karachi', 'Karachi', 'Islamabad', 'Islamabad', 'Quetta', 'Lahore', 'Faislabad', 'Lahore', 'Islamabad'],
'Employee_Age':[60, 23, 25, 32, 43, 26, 30, 23, 35]
})
df.groupby(['Employee_city','Employee_Names']).size().unstack().plot(kind='bar',stacked=True, fontsize='6')
plt.show()
In the below-given graph, the number of employees stacked who belong to the same city.

Change Column Name with the group by
You can also change the aggregated column name with some new modified name as follows:
import matplotlib.pyplot as plt
df = pd.DataFrame({
'Employee_Names':['Sam', 'Ali' , 'Umar', 'Raees', 'Mahwish', 'Hania', 'Mirha', 'Maria', 'Hamza'],
'Designation':['Manager', 'Staff', 'IT officer', 'IT officer', 'HR', 'Staff', 'HR', 'Staff', 'Team Lead'],
'Employee_city':['Karachi', 'Karachi', 'Islamabad', 'Islamabad', 'Quetta', 'Lahore', 'Faislabad', 'Lahore', 'Islamabad'],
'Employee_Age':[60, 23, 25, 32, 43, 26, 30, 23, 35]
})
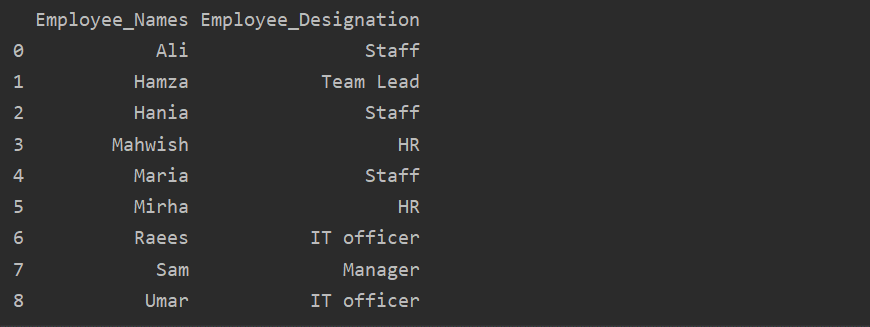
df1 = df.groupby('Employee_Names')['Designation'].sum().reset_index(name='Employee_Designation')
print(df1)
In the above example, the ‘Designation’ name is changed to ‘Employee_Designation’.
Retrieve Group by key or value
Using the groupby statement, you can retrieve similar records or values from the dataframe.
Example
In the below-given example, we have group data based on ‘Designation’. Then, the ‘Staff’ group is retrieved by using the .getgroup(‘Staff’).
import matplotlib.pyplot as plt
df = pd.DataFrame({
'Employee_Names':['Sam', 'Ali' , 'Umar', 'Raees', 'Mahwish', 'Hania', 'Mirha', 'Maria', 'Hamza'],
'Designation':['Manager', 'Staff', 'IT officer', 'IT officer', 'HR', 'Staff', 'HR', 'Staff', 'Team Lead'],
'Employee_city':['Karachi', 'Karachi', 'Islamabad', 'Islamabad', 'Quetta', 'Lahore', 'Faislabad', 'Lahore', 'Islamabad'],
'Employee_Age':[60, 23, 25, 32, 43, 26, 30, 23, 35]
})
extract_value = df.groupby('Designation')
print(extract_value.get_group('Staff'))
The following result displays in the output window:

Add Value into group List
Similar data can be displayed in the form of a list by using the groupby statement. First, group the data based on a condition. Then, by applying the function, you can easily put this group into the lists.
Example
In this example, we have inserted similar records into the group list. All the employees are divided into the group based on ’Employee_city’, and then by applying the ‘Lambda’ function, this group is retrieved in the form of a list.
df = pd.DataFrame({
'Employee_Names':['Sam', 'Ali' , 'Umar', 'Raees', 'Mahwish', 'Hania', 'Mirha', 'Maria', 'Hamza'],
'Designation':['Manager', 'Staff', 'IT officer', 'IT officer', 'HR', 'Staff', 'HR', 'Staff', 'Team Lead'],
'Employee_city':['Karachi', 'Karachi', 'Islamabad', 'Islamabad', 'Quetta', 'Lahore', 'Faislabad', 'Lahore', 'Islamabad'],
'Employee_Age':[60, 23, 25, 32, 43, 26, 30, 23, 35]
})
df1=df.groupby('Employee_city')['Employee_Names'].apply(lambda group_series: group_series.tolist()).reset_index()
print(df1)

Use of Transform function with groupby
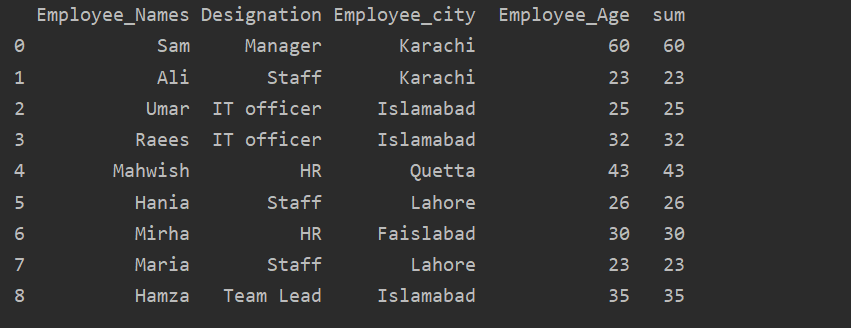
The employees are grouped according to their age, these values added together, and by using the ‘transform’ function new column is added in the table:
df = pd.DataFrame({
'Employee_Names':['Sam', 'Ali' , 'Umar', 'Raees', 'Mahwish', 'Hania', 'Mirha', 'Maria', 'Hamza'],
'Designation':['Manager', 'Staff', 'IT officer', 'IT officer', 'HR', 'Staff', 'HR', 'Staff', 'Team Lead'],
'Employee_city':['Karachi', 'Karachi', 'Islamabad', 'Islamabad', 'Quetta', 'Lahore', 'Faislabad', 'Lahore', 'Islamabad'],
'Employee_Age':[60, 23, 25, 32, 43, 26, 30, 23, 35]
})
df['sum']=df.groupby(['Employee_Names'])['Employee_Age'].transform('sum')
print(df)
Conclusion
We have explored the different uses of groupby statement in this article. We have shown how you can divide the data into groups, and by applying different aggregations or functions, you can easily retrieve these groups.
]]>Split Method
The “split()” method can be used to split words using a user specified separator. It returns a list of splitted words without including the separator. If no separator is specified by the user, whitespace (one or more) is used as a single separator.
For instance, the code below will return “[‘Linux’, ‘Hint’]” as output:
text.split()
The code below will return “[‘LinuxHint’, ‘com’]” as output when “.” is used as separator:
text.split(“.”)
The separator doesn’t have to be a single character. The split method takes two arguments:
- sep: separator to be used for splitting
- maxsplit: number of splits to do
Both these arguments are optional. As mentioned above, if the “sep” argument is not specified, whitespace is used as a separator for splitting. The “maxsplit” argument has a default value of “-1” and it splits all occurrences by default. Consider the code below:
text.split(“.”)
It will return “[‘LinuxHint’, ‘co’, ‘us’]” as output. If you want to stop splitting at the first occurrence of the separator, specify “1” as the “maxsplit” argument.
text.split(“.”, 1)
The code above will return “[‘LinuxHint’, ‘co.us’]” as output. Just specify the number of occurrences where you want the split process to stop as the second argument.
Note that if there are consecutive separators, an empty string will be for returned for the remaining separators after the first split (when “maxsplit” argument is not used):
text.split(".")
The code above will return “[‘LinuxHint’, ”, ‘com’]” as output. In case you want to remove empty strings from the resulting list, you can use the following list comprehension statement:
result = text.split(".")
result = [item for item in result if item != ""]
print (result)
You will get “[‘LinuxHint’, ‘com’]” as the output after running the above code sample.
Note that the “split()” method moves from left to right to split strings into words. If you want to split string from right to left direction, use “rsplit()” instead. Its syntax, usage and arguments are exactly the same as the “split()” method.
If no separator is found in the string while using “split()” or “rsplit()” methods, the original string is returned as the sole list element.
Partition Method
The “partition()” method can be used to split strings and it works identical to the “split()” method with some differences. The most notable difference is that it retains the separator and includes it as an item in the resulting tuple containing splitted words. This is especially useful if you want to divide the string into an iterable object (tuple in this case) without removing any original characters. Consider the code below:
result = text.partition(".")
print (result)
The above code sample will return “(‘LinuxHint’, ‘.’, ‘com’)” as the output. If you want the result to be of list type, use the following code sample instead:
result = list(text.partition("."))
print (result)
You should get “[‘LinuxHint’, ‘.’, ‘com’]” as output after running the above code sample.
The “partition()” method takes only one argument called “sep”. Users can specify a separator of any length. Unlike the “split()” method, this argument is mandatory, so you can’t omit the separator. However, you can specify whitespace as a separator.
Note that the partition method stops at the first occurrence of the separator. So if your string contains multiple separators, the “partition()” method will ignore all other occurrences. Here is an example illustrating this:
result = list(text.partition("."))
print (result)
The code sample will produce “[‘LinuxHint’, ‘.’, ‘co.us’]” as output. If you want to split at all occurrences of the separator and include the separator in the final list as well, you may have to use a “Regular Expression” or “RegEx” pattern. For the example mentioned above, you can use a RegEx pattern in the following way:
text = "LinuxHint.co.us"
result = re.split("(\.)", text)
print (result)
You will get “[‘LinuxHint’, ‘.’, ‘co’, ‘.’, ‘us’]” as output after executing the above code sample. The dot character has been escaped in the RegEx statement mentioned above. Note that while the example above works with a single dot character, it may not work with complex separators and complex strings. You may have to define your own RegEx pattern depending on your use case. The example is just mentioned here to give you some idea about the process of retaining the separator in the final list using RegEx statements.
The “partition()” method can sometimes leave empty strings, especially when the separator is not found in the string to be splitted. In such cases, you can use list comprehension statements to remove empty strings, as explained in the “split()” method section above.
result = list(text.partition("."))
result = [item for item in result if item != ""]
print (result)
After running the above code, you should get “[‘LinuxHint’]” as output.
Conclusion
For simple and straightforward splits, you can use “split()” and “partition()” methods to get iterable types. For complex strings and separators, you will need to use RegEx statements.
]]>Pandas DataFrame is a 2D (two dimensional) annotated data structure in which data is aligned in the tabular form with different rows and columns. For easier understanding, the DataFrame behaves like a spreadsheet that contains three different components: index, columns, and data. Pandas DataFrames are the most common way to utilize the panda’s objects.
Pandas DataFrames can be created using different methods. This article will explain all possible methods through which you can create Pandas DataFrame in python. We have run all examples on the pycharm tool. Let’s start the implementation of each method one by one.
Basic Syntax
Follow the following syntax while creating DataFrames in Pandas python:
Example:Let’s explain with an example. In this case, we have stored the data of student’s names and percentages in a ‘Students_Data’ variable. Further, using the pd.DataFrame (), we have created a DataFrames for displaying student’s result.
Students_Data = {
'Name':['Samreena', 'Asif', 'Mahwish', 'Raees'],
'Percentage':[90,80,70,85]}
result = pd.DataFrame(Students_Data)
print (result)

Methods to Create Pandas DataFrames
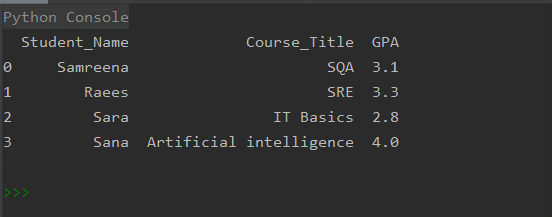
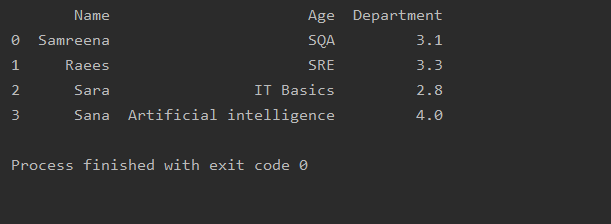
Pandas DataFrames can be created using the different ways that we will discuss in the rest of the article. We will print the Student’s courses result in the form of DataFrames. So, using one of the following methods, you can create similar DataFrames that are represented in the following image:
Method # 01: Creating Pandas DataFrame from the dictionary of lists
In the following example, DataFrames are created from the dictionaries of lists related to student’s course results. First, import a panda’s library and then create a dictionary of lists. The dict keys represent the column names such as ‘Student_Name’, ‘Course_Title’, and ‘GPA’. Lists represent the column’s data or content. The ‘dictionary_lists’ variable contains the data of students that are further assigned to the ‘df1’ variable. Using the print statement, print the all content of DataFrames.
Example:
import pandas as pd
# Import panda’s library
import pandas as pd
# Create a dictionary of list
dictionary_lists = {
'Student_Name': ['Samreena', 'Raees', 'Sara', 'Sana'],
'Course_Title': ['SQA','SRE','IT Basics', 'Artificial intelligence'],
'GPA': [3.1, 3.3, 2.8, 4.0]}
# Create the DataFrame
dframe = pd.DataFrame(dictionary_lists)
print(dframe)
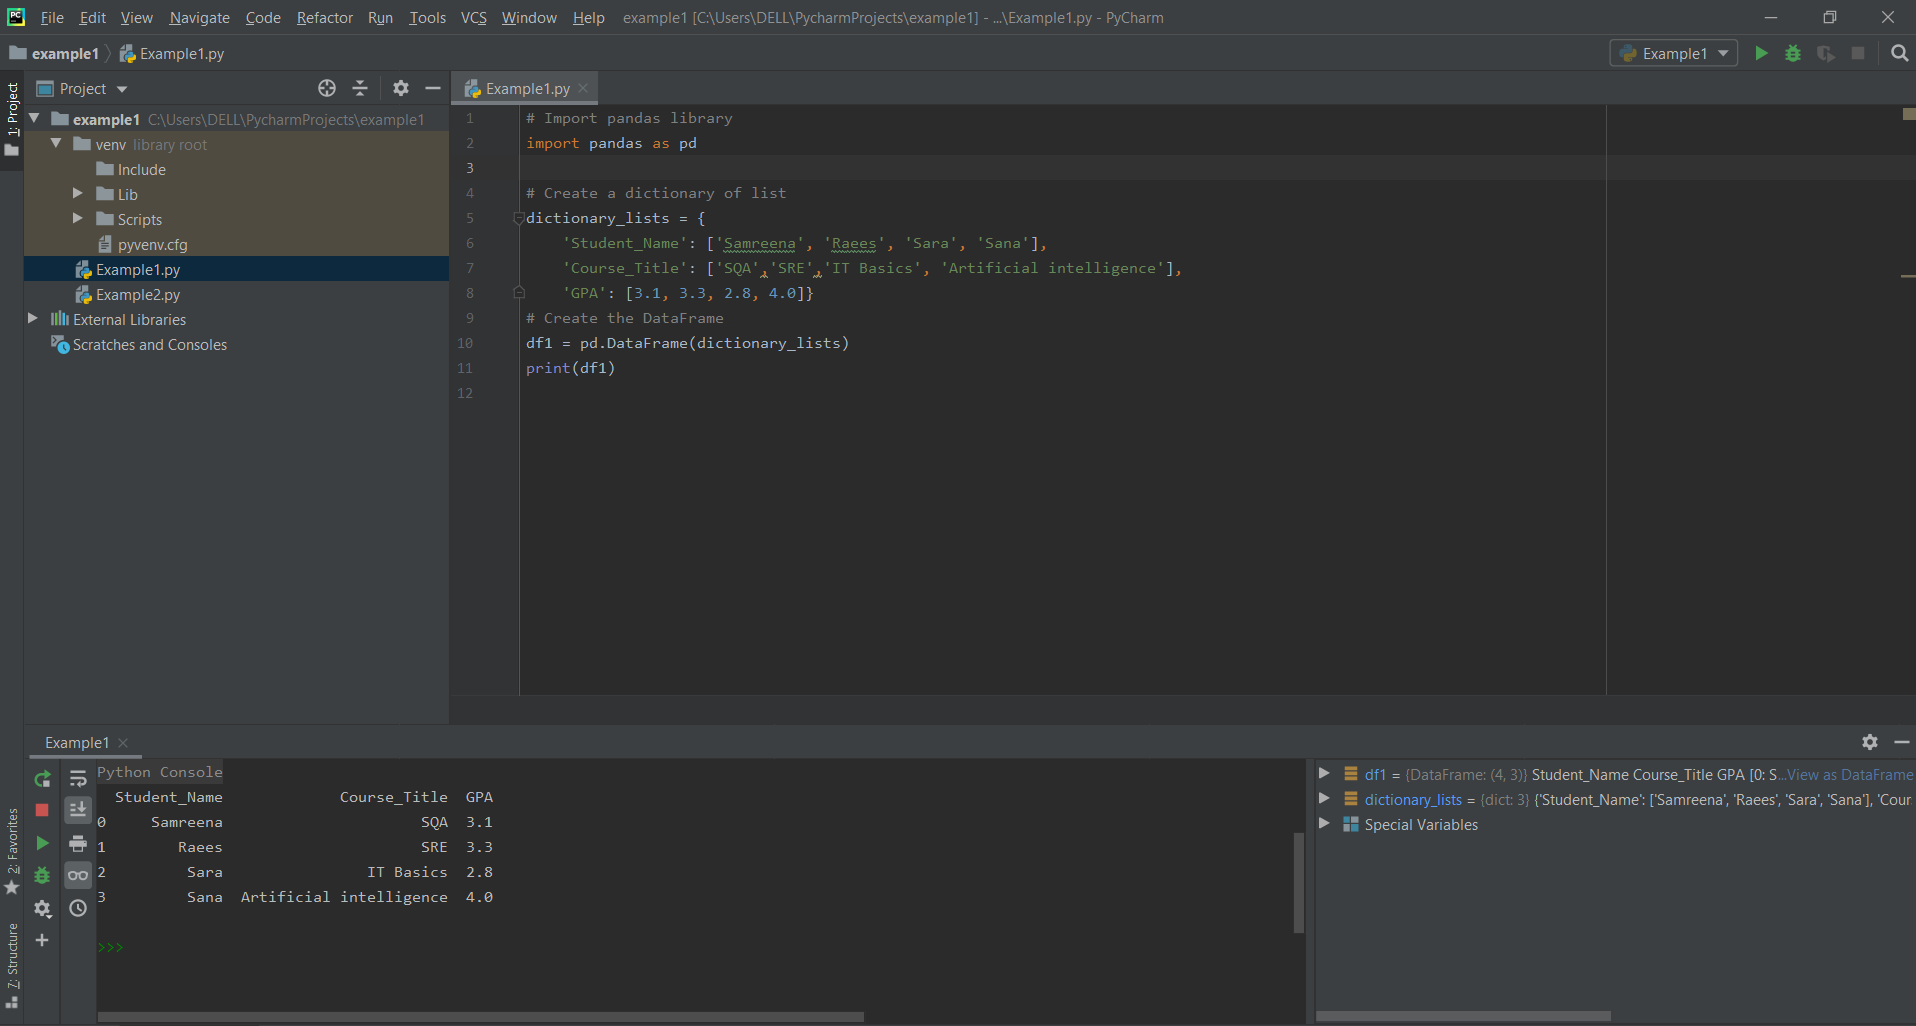
After executing the above code, the following output will be displayed:
Method # 02: Create Pandas DataFrame from the dictionary of NumPy array
The DataFrame can be created from the dict of array/list. For this purpose, the length must be the same as all the narray. If some index is passed, then the index length should be equal to the array’s length. If no one index is passed, then, in this case, the default index to be a range (n). Here, n represents the array’s length.
Example:
# Create a numpy array
nparray = np.array(
[['Samreena', 'Raees', 'Sara', 'Sana'],
['SQA', 'SRE', 'IT Basics','Artificial Intelligence'],
[3.1, 3.3, 2.8, 4.0]])
# Create a dictionary of nparray
dictionary_of_nparray = {
'Student_Name': nparray[0],
'Course_Title': nparray[1],
'GPA': nparray[2]}
# Create the DataFrame
dframe = pd.DataFrame(dictionary_of_nparray)
print(dframe)
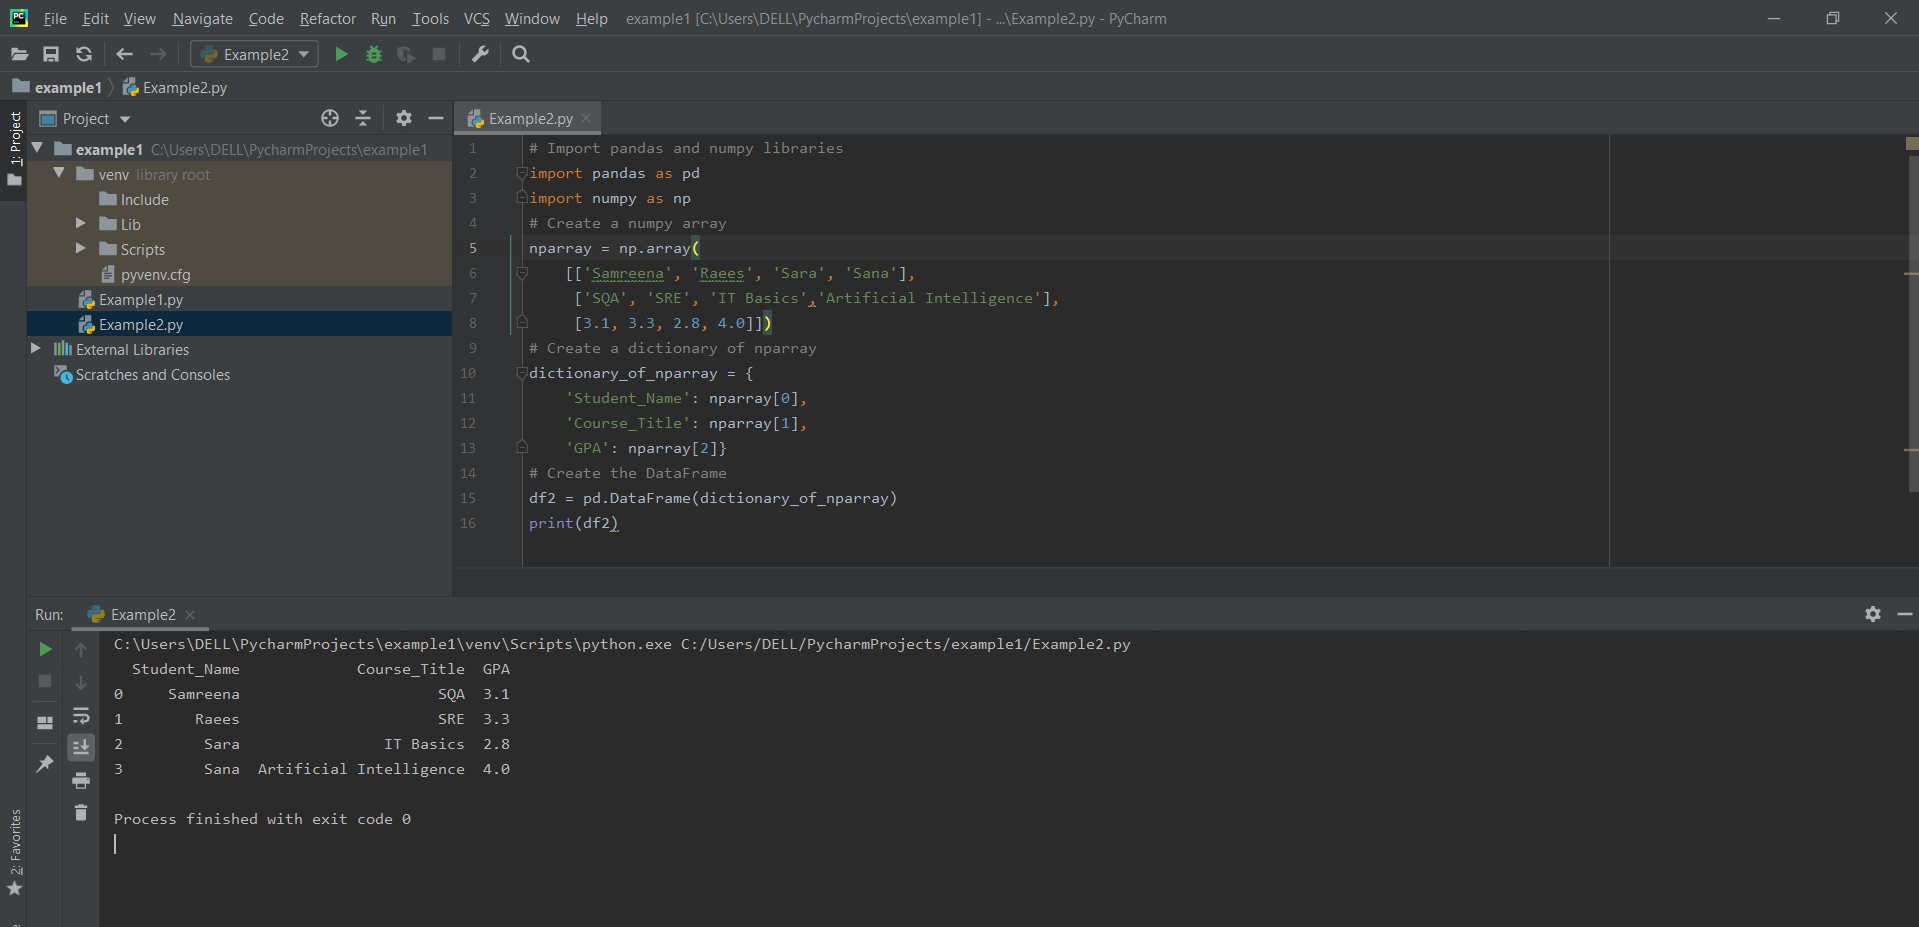
Method # 03: Creating pandas DataFrame using the list of lists
In the following code, each line represents a single row.
Example:
import pandas as pd
# Create a list of lists
group_lists = [
['Samreena', 'SQA', 3.1],
['Raees', 'SRE', 3.3],
['Sara', 'IT Basics', 2.8],
['Sana', 'Artificial Intelligence', 4.0]]
# Create the DataFrame
dframe = pd.DataFrame(group_lists, columns = ['Student_Name', 'Course_Title', 'GPA'])
print(dframe)
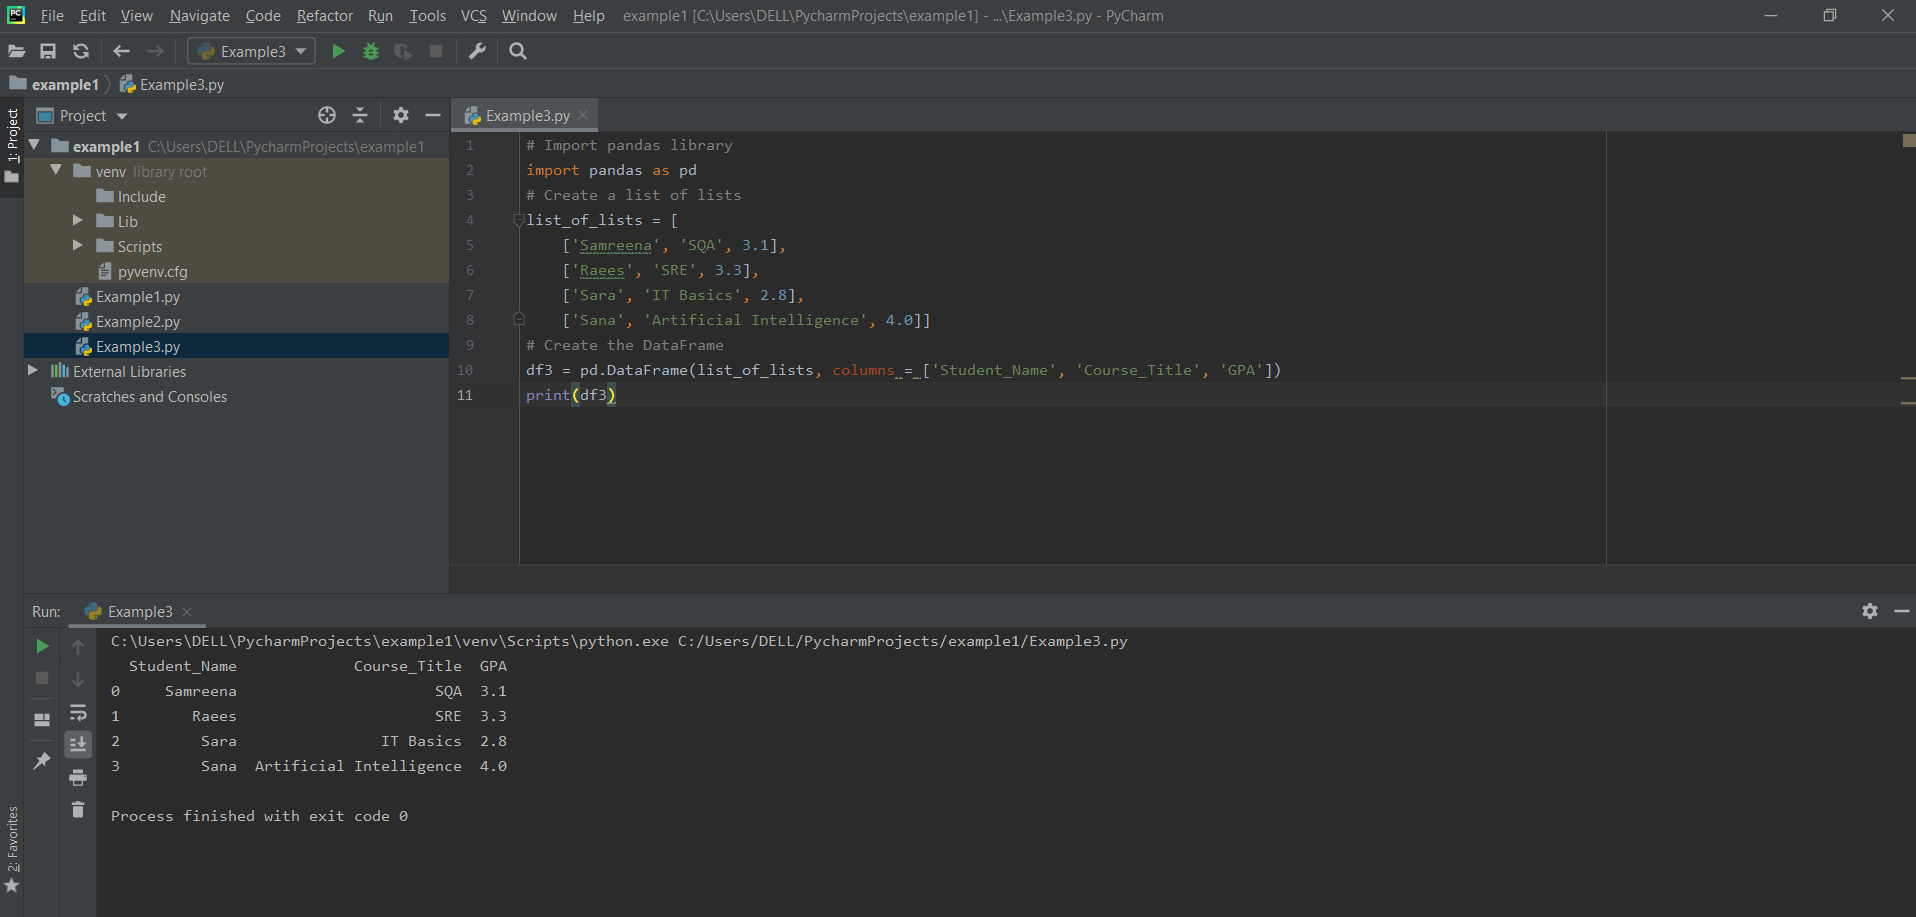
Method # 04: Creating pandas DataFrame using the list of dictionary
In the following code, each dictionary represents a single row and keys that represent the column names.
Example:
import pandas as pd
# Create a list of dictionaries
dict_list = [
{'Student_Name': 'Samreena', 'Course_Title': 'SQA', 'GPA': 3.1},
{'Student_Name': 'Raees', 'Course_Title': 'SRE', 'GPA': 3.3},
{'Student_Name': 'Sara', 'Course_Title': 'IT Basics', 'GPA': 2.8},
{'Student_Name': 'Sana', 'Course_Title': 'Artificial Intelligence', 'GPA': 4.0}]
# Create the DataFrame
dframe = pd.DataFrame(dict_list)
print(dframe)
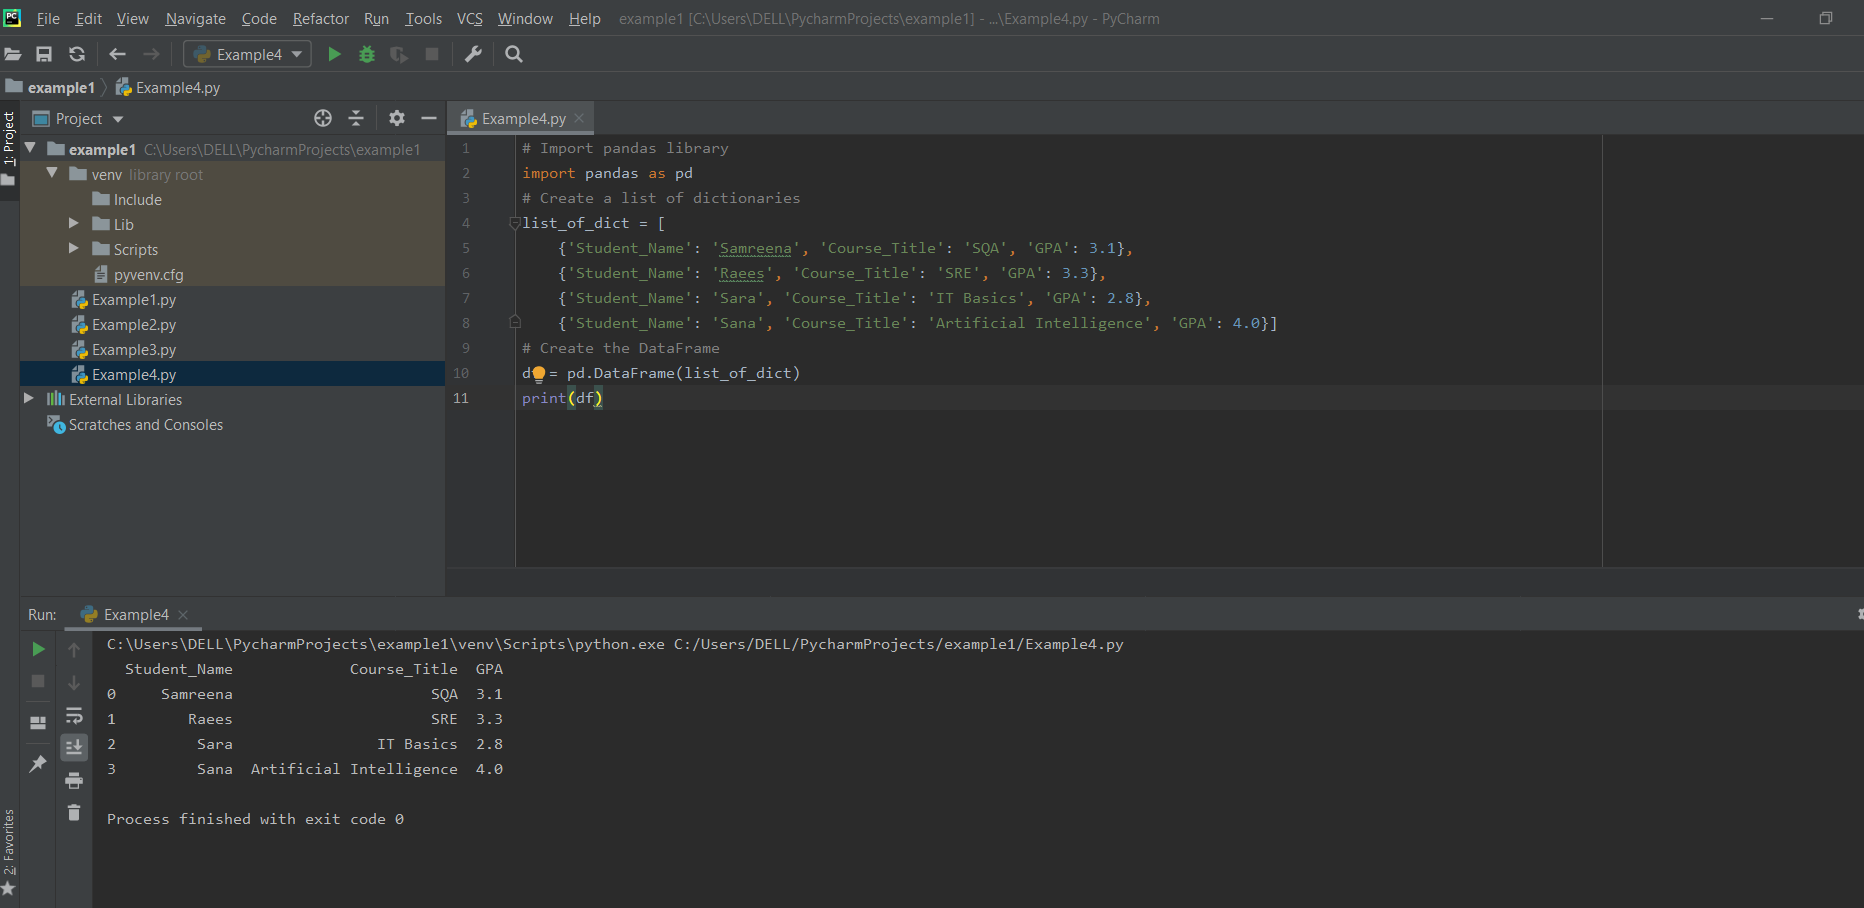
Method # 05: Creating pandas Dataframe from dict of pandas Series
The dict keys represent the names of columns and each Series represents column contents. In the following lines of code, we have taken three types of series: Name_series, Course_series, and GPA_series.
Example:
import pandas as pd
# Create the Series of student names
Name_series = pd.Series(['Samreena', 'Raees', 'Sara', 'Sana'])
Course_series = pd.Series(['SQA', 'SRE', 'IT Basics', 'Artificial intelligence'])
GPA_series = pd.Series([3.1, 3.3, 2.8, 4.0])
# Create a Series Dictionary
dictionary_of_nparray
\
‘] = {'Name': Name_series, 'Age': Course_series, 'Department': GPA_series}
# DataFrame creation
dframe = pd.DataFrame(dictionary_of_nparray)
print(dframe)
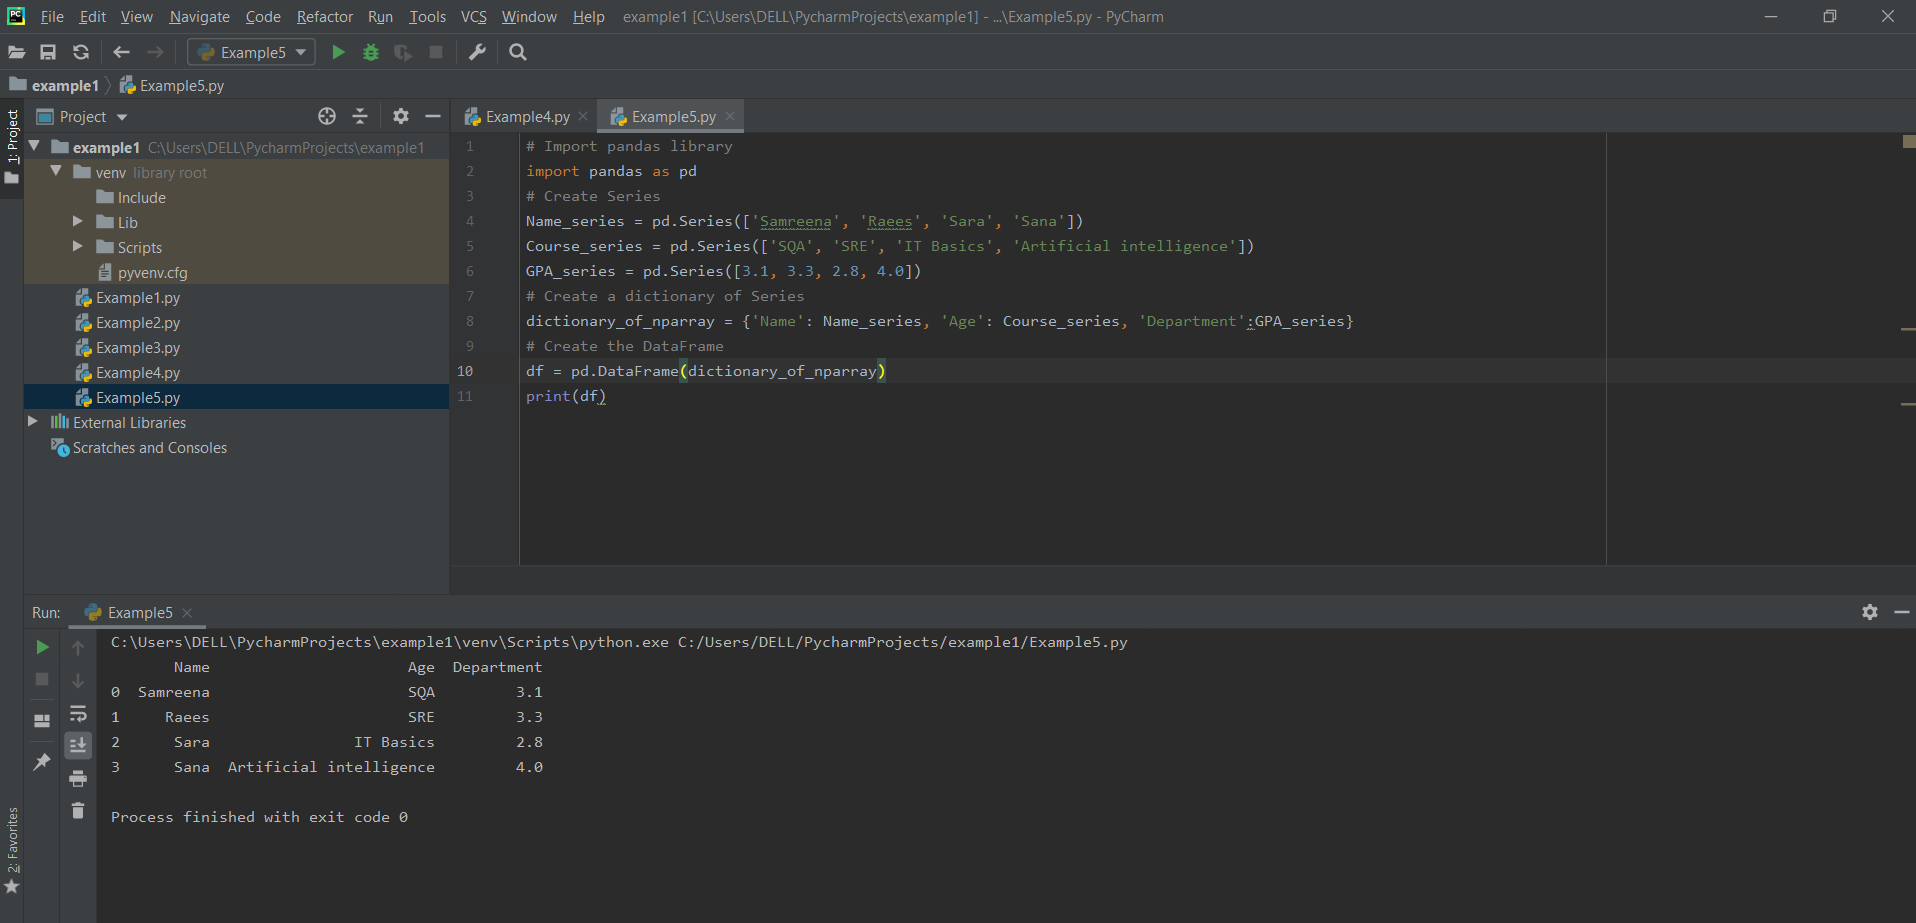
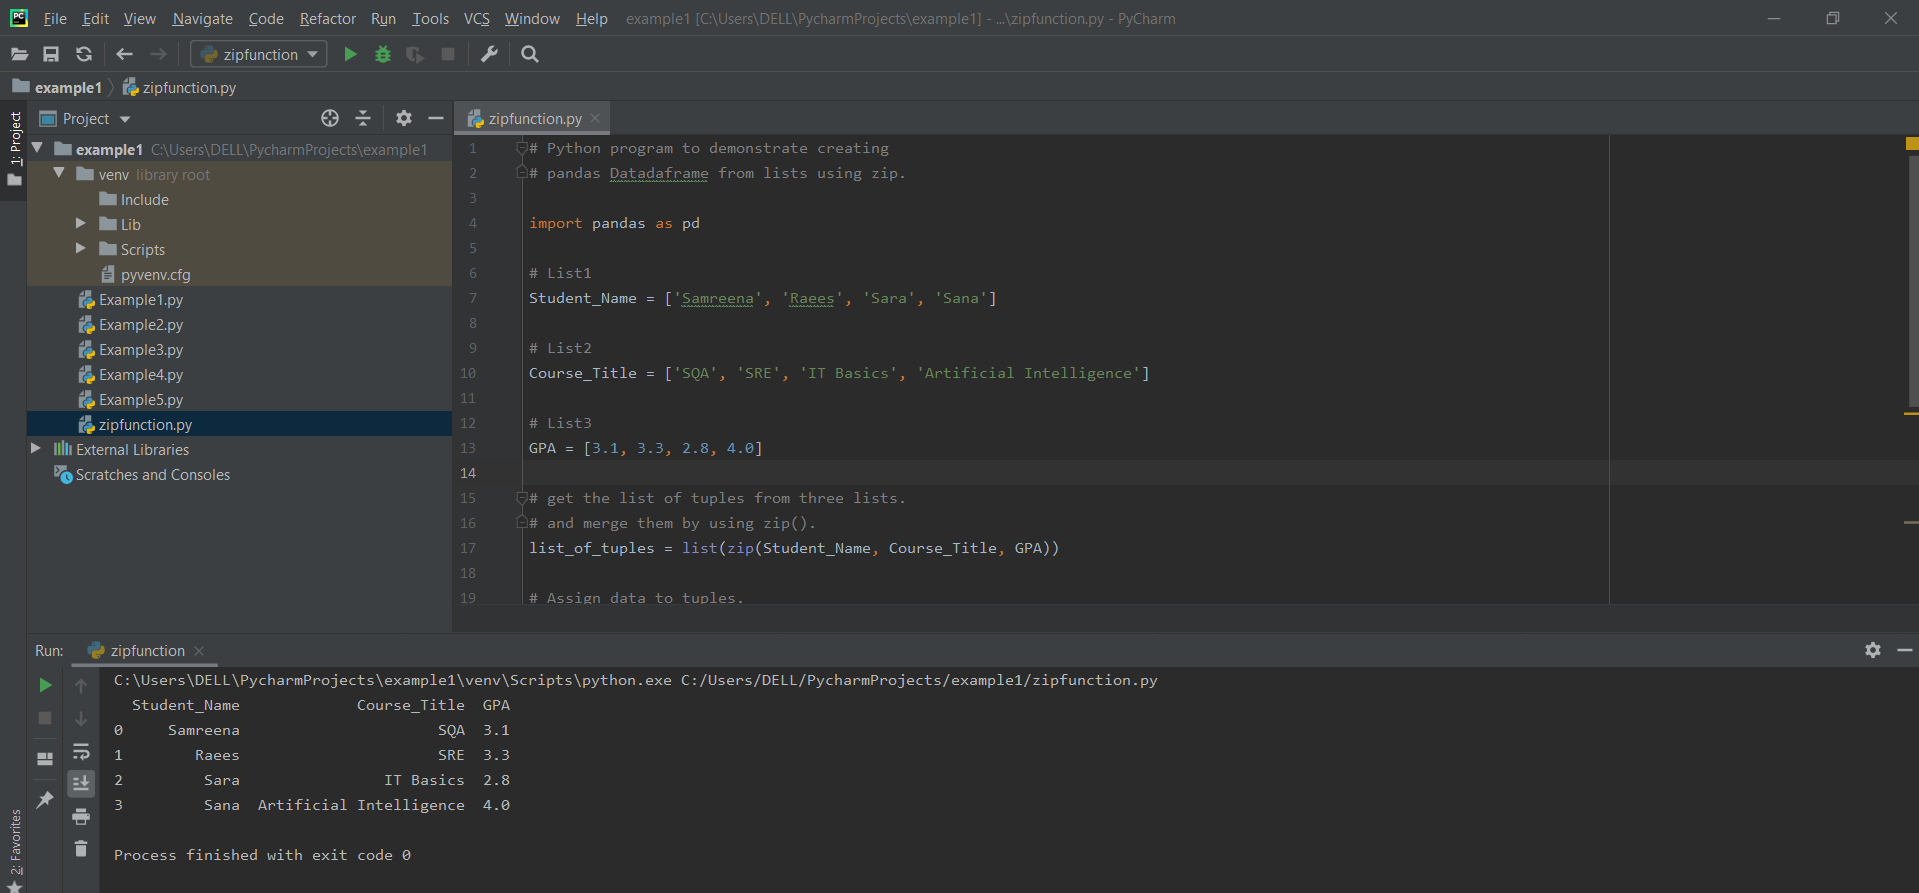
Method # 06: Create Pandas DataFrame by using zip() function.
Different lists can be merged through the list(zip()) function. In the following example, pandas DataFrame are created by calling pd.DataFrame() function. Three different lists are created that are merged in the form of tuples.
Example:
# List1
Student_Name = ['Samreena', 'Raees', 'Sara', 'Sana']
# List2
Course_Title = ['SQA', 'SRE', 'IT Basics', 'Artificial Intelligence']
# List3
GPA = [3.1, 3.3, 2.8, 4.0]
# Take the list of tuples from three lists further, merge them by use of zip().
tuples = list(zip(Student_Name, Course_Title, GPA))
# Assign data values to tuples.
tuples
# Converting tuples list into pandas Dataframe.
dframe = pd.DataFrame(tuples, columns=['Student_Name', 'Course_Title', 'GPA'])
# Print data.
print(dframe)
Conclusion
Using the above methods, you can create Pandas DataFrames in python. We have printed a student’s course GPA by creating Pandas DataFrames. Hopefully, you will get useful results after running the above-mentioned examples. All programs are commented well for better understanding. If you have more ways to create Pandas DataFrames, then do not hesitate to share them with us. Thanks for reading this tutorial.
]]>We will explore the uses of merge function, concat function, and different types of joins operations in Pandas python in this article. All examples will be executed through the pycharm editor. Let’s start with the details!
Use of Merge Function
The basic commonly used syntax of merge () function is given-below:
Let’s explain the details of the parameters:
The first two df_obj1 and df_obj2 arguments are the names of the DataFrame objects or tables.
The “how” parameter is used for different types of join operations such as “left, right, outer, and inner”. The merge function uses “inner” join operation by default.
The argument “on” contains the column name on which the join operation is performed. This column must be present in both DataFrame objects.
In the “left_on” and “right_on” arguments, “left_on” is the name of the column name as the key in the left DataFrame. The “right_on” is the name of the column used as a key from the right DataFrame.
To elaborate on the concept of joining DataFrames, we have taken two DataFrame objects- product and customer. The following details are present in the product DataFrame:
'Product_ID':[101,102,103,104,105,106,107],
'Product_Name':['headphones','Bag','Shoes','Smartphone','Teeth brush','wrist watch','Laptop'],
'Category':['Electronics','Fashion','Fashion','Electronics','Grocery','Fashion','Electronics'],
'Price':[300.0,1000.50,2000.0,21999.0,145.0,1500.0,90999.0],
'Seller_City':['Islamabad','Lahore','Karachi','Rawalpindi','Islamabad','Karachi','Faisalabad']
})
The customer DataFrame contains the following details:
'ID':[1,2,3,4,5,6,7,8,9],
'Customer_Name':['Sara','Sana','Ali','Raees','Mahwish','Umar','Mirha','Asif','Maria'],
'Age':[20,21,15,10,31,52,15,18,16],
'Product_ID':[101,0,106,0,103,104,0,0,107],
'Product_Purchased':['headphones','NA','wrist watch','NA','Shoes','Smartphone','NA','NA','Laptop'],
'Customer_City':['Lahore','Islamabad','Faisalabad','Karachi','Karachi','Islamabad','Rawalpindi','Islamabad',
'Lahore']
})
Join DataFrames on a Key
We can easily find products sold online and the customers who purchased them. So, based on a key “Product_ID”, we have performed inner join operation on both DataFrames as follows:
import pandas as pd
product=pd.DataFrame({
'Product_ID':[101,102,103,104,105,106,107],
'Product_Name':['headphones','Bag','Shoes','Smartphone','Teeth brush','wrist watch','Laptop'],
'Category':['Electronics','Fashion','Fashion','Electronics','Grocery','Fashion','Electronics'],
'Price':[300.0,1000.50,2000.0,21999.0,145.0,1500.0,90999.0],
'Seller_City':['Islamabad','Lahore','Karachi','Rawalpindi','Islamabad','Karachi','Faisalabad']
})
customer=pd.DataFrame({
'ID':[1,2,3,4,5,6,7,8,9],
'Customer_Name':['Sara','Sana','Ali','Raees','Mahwish','Umar','Mirha','Asif','Maria'],
'Age':[20,21,15,10,31,52,15,18,16],
'Product_ID':[101,0,106,0,103,104,0,0,107],
'Product_Purchased':['headphones','NA','wrist watch','NA','Shoes','Smartphone','NA','NA','Laptop'],
'City':['Lahore','Islamabad','Faisalabad','Karachi','Karachi','Islamabad','Rawalpindi','Islamabad',
'Lahore']
})
print (pd.merge(product,customer,on='Product_ID'))
The following output displays on the window after running the above code:

If the columns are different in both DataFrames then, explicitly write the name of each column by the left_on and right_on arguments as follows:
product=pd.DataFrame({
'Product_ID':[101,102,103,104,105,106,107],
'Product_Name':['headphones','Bag','Shoes','Smartphone','Teeth brush','wrist watch','Laptop'],
'Category':['Electronics','Fashion','Fashion','Electronics','Grocery','Fashion','Electronics'],
'Price':[300.0,1000.50,2000.0,21999.0,145.0,1500.0,90999.0],
'Seller_City':['Islamabad','Lahore','Karachi','Rawalpindi','Islamabad','Karachi','Faisalabad']
})
customer=pd.DataFrame({
'ID':[1,2,3,4,5,6,7,8,9],
'Customer_Name':['Sara','Sana','Ali','Raees','Mahwish','Umar','Mirha','Asif','Maria'],
'Age':[20,21,15,10,31,52,15,18,16],
'Product_ID':[101,0,106,0,103,104,0,0,107],
'Product_Purchased':['headphones','NA','wrist watch','NA','Shoes','Smartphone','NA','NA','Laptop'],
'City':['Lahore','Islamabad','Faisalabad','Karachi','Karachi','Islamabad','Rawalpindi','Islamabad',
'Lahore']
})
print (pd.merge(product,customer,left_on='Product_Name',right_on='Product_Purchased'))
The following output will show on the screen:

Join DataFrames using How Argument
In the following examples, we will explain four types of Joins operations on Pandas DataFrames:
- Inner Join
- Outer Join
- Left Join
- Right Join
Inner Join in Pandas
We can perform an inner join on multiple keys. To display more details about the product sales, take Product_ID, Seller_City from the product DataFrame and Product_ID, and “Customer_City” from the customer DataFrame to find that either seller or customer belongs to the same city. Implement the following lines of code:
import pandas as pd
product=pd.DataFrame({
'Product_ID':[101,102,103,104,105,106,107],
'Product_Name':['headphones','Bag','Shoes','Smartphone','Teeth brush','wrist watch','Laptop'],
'Category':['Electronics','Fashion','Fashion','Electronics','Grocery','Fashion','Electronics'],
'Price':[300.0,1000.50,2000.0,21999.0,145.0,1500.0,90999.0],
'Seller_City':['Islamabad','Lahore','Karachi','Rawalpindi','Islamabad','Karachi','Faisalabad']
})
customer=pd.DataFrame({
'ID':[1,2,3,4,5,6,7,8,9],
'Customer_Name':['Sara','Sana','Ali','Raees','Mahwish','Umar','Mirha','Asif','Maria'],
'Age':[20,21,15,10,31,52,15,18,16],
'Product_ID':[101,0,106,0,103,104,0,0,107],
'Product_Purchased':['headphones','NA','wrist watch','NA','Shoes','Smartphone','NA','NA','Laptop'],
'Customer_City':['Lahore','Islamabad','Faisalabad','Karachi','Karachi','Islamabad','Rawalpindi','Islamabad',
'Lahore']
})
print (pd.merge(product,customer,how='inner',left_on=['Product_ID','Seller_City'],right_on=['Product_ID','Customer_City']))
The following result shows on the window after running the above code:

Full/outer join in Pandas
Outer joins return both right and left DataFrames values, which either have matches. So, to implement the outer join, set the “how” argument as outer. Let’s modify the above example by using the outer join concept. In the below code, it will return all values of both left and right DataFrames.
import pandas as pd
product=pd.DataFrame({
'Product_ID':[101,102,103,104,105,106,107],
'Product_Name':['headphones','Bag','Shoes','Smartphone','Teeth brush','wrist watch','Laptop'],
'Category':['Electronics','Fashion','Fashion','Electronics','Grocery','Fashion','Electronics'],
'Price':[300.0,1000.50,2000.0,21999.0,145.0,1500.0,90999.0],
'Seller_City':['Islamabad','Lahore','Karachi','Rawalpindi','Islamabad','Karachi','Faisalabad']
})
customer=pd.DataFrame({
'ID':[1,2,3,4,5,6,7,8,9],
'Customer_Name':['Sara','Sana','Ali','Raees','Mahwish','Umar','Mirha','Asif','Maria'],
'Age':[20,21,15,10,31,52,15,18,16],
'Product_ID':[101,0,106,0,103,104,0,0,107],
'Product_Purchased':['headphones','NA','wrist watch','NA','Shoes','Smartphone','NA','NA','Laptop'],
'Customer_City':['Lahore','Islamabad','Faisalabad','Karachi','Karachi','Islamabad','Rawalpindi','Islamabad',
'Lahore']
})
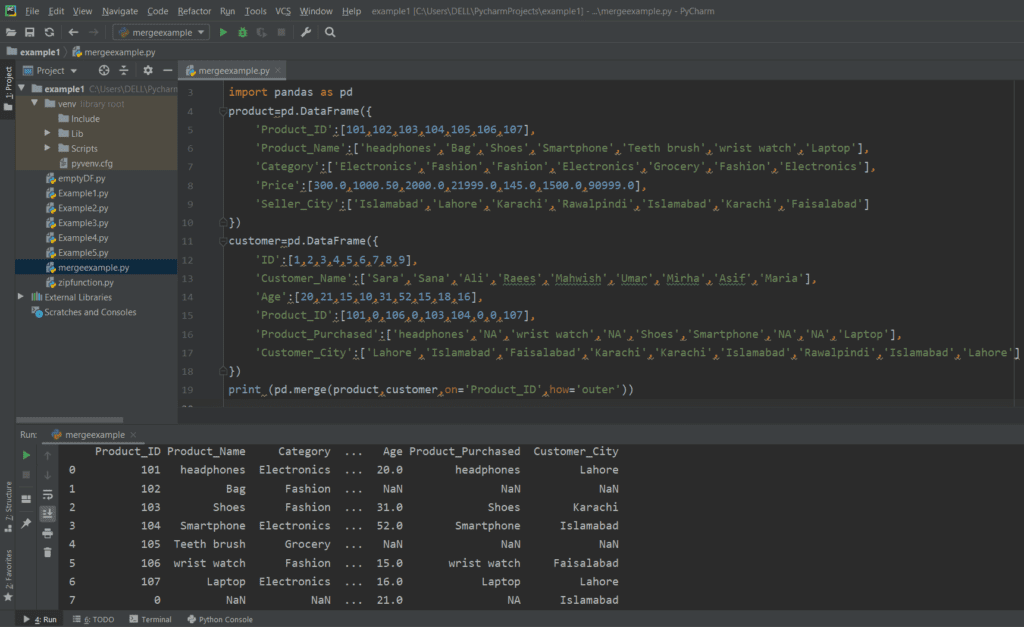
print (pd.merge(product,customer,on='Product_ID',how='outer'))
Set the indicator argument as “True”s. You will notice that the new “_merge” column is added at the end.
import pandas as pd
product=pd.DataFrame({
'Product_ID':[101,102,103,104,105,106,107],
'Product_Name':['headphones','Bag','Shoes','Smartphone','Teeth brush','wrist watch','Laptop'],
'Category':['Electronics','Fashion','Fashion','Electronics','Grocery','Fashion','Electronics'],
'Price':[300.0,1000.50,2000.0,21999.0,145.0,1500.0,90999.0],
'Seller_City':['Islamabad','Lahore','Karachi','Rawalpindi','Islamabad','Karachi','Faisalabad']
})
customer=pd.DataFrame({
'ID':[1,2,3,4,5,6,7,8,9],
'Customer_Name':['Sara','Sana','Ali','Raees','Mahwish','Umar','Mirha','Asif','Maria'],
'Age':[20,21,15,10,31,52,15,18,16],
'Product_ID':[101,0,106,0,103,104,0,0,107],
'Product_Purchased':['headphones','NA','wrist watch','NA','Shoes','Smartphone','NA','NA','Laptop'],
'Customer_City':['Lahore','Islamabad','Faisalabad','Karachi','Karachi','Islamabad','Rawalpindi','Islamabad',
'Lahore']
})
print (pd.merge(product,customer,on='Product_ID',how='outer',indicator=True))
As you can see in the below screenshot, the merge column values explain which row belongs to which DataFrame.

Left Join in Pandas
Left join only display rows of the left DataFrame. It is similar to the outer join. So, change the ‘how’ argument value with “left”. Try the following code to implement the idea of Left join:
import pandas as pd
product=pd.DataFrame({
'Product_ID':[101,102,103,104,105,106,107],
'Product_Name':['headphones','Bag','Shoes','Smartphone','Teeth brush','wrist watch','Laptop'],
'Category':['Electronics','Fashion','Fashion','Electronics','Grocery','Fashion','Electronics'],
'Price':[300.0,1000.50,2000.0,21999.0,145.0,1500.0,90999.0],
'Seller_City':['Islamabad','Lahore','Karachi','Rawalpindi','Islamabad','Karachi','Faisalabad']
})
customer=pd.DataFrame({
'ID':[1,2,3,4,5,6,7,8,9],
'Customer_Name':['Sara','Sana','Ali','Raees','Mahwish','Umar','Mirha','Asif','Maria'],
'Age':[20,21,15,10,31,52,15,18,16],
'Product_ID':[101,0,106,0,103,104,0,0,107],
'Product_Purchased':['headphones','NA','wrist watch','NA','Shoes','Smartphone','NA','NA','Laptop'],
'Customer_City':['Lahore','Islamabad','Faisalabad','Karachi','Karachi','Islamabad','Rawalpindi','Islamabad',
'Lahore']
})
print (pd.merge(product,customer,on='Product_ID',how='left'))

Right Join in Pandas
The right join keeps all right DataFrame rows to the right along with the rows that are also common in the left DataFrame. In this case, the “how” argument is set as the “right” value. Run the following code to implement the right join concept:
import pandas as pd
product=pd.DataFrame({
'Product_ID':[101,102,103,104,105,106,107],
'Product_Name':['headphones','Bag','Shoes','Smartphone','Teeth brush','wrist watch','Laptop'],
'Category':['Electronics','Fashion','Fashion','Electronics','Grocery','Fashion','Electronics'],
'Price':[300.0,1000.50,2000.0,21999.0,145.0,1500.0,90999.0],
'Seller_City':['Islamabad','Lahore','Karachi','Rawalpindi','Islamabad','Karachi','Faisalabad']
})
customer=pd.DataFrame({
'ID':[1,2,3,4,5,6,7,8,9],
'Customer_Name':['Sara','Sana','Ali','Raees','Mahwish','Umar','Mirha','Asif','Maria'],
'Age':[20,21,15,10,31,52,15,18,16],
'Product_ID':[101,0,106,0,103,104,0,0,107],
'Product_Purchased':['headphones','NA','wrist watch','NA','Shoes','Smartphone','NA','NA','Laptop'],
'Customer_City':['Lahore','Islamabad','Faisalabad','Karachi','Karachi','Islamabad','Rawalpindi','Islamabad',
'Lahore']
})
print (pd.merge(product,customer,on='Product_ID',how='right'))
In the following screenshot, you can see the result after running the above code:

Joining of DataFrames using the Concat () function
Two DataFrames can be joined using the concat function. The basic syntax of the concatenation function is given below:
Two DataFrames objects will pass as arguments.
Let’s join both DataFrames product and customer through the concat function. Run the following lines of code to join two DataFrames:
import pandas as pd
product=pd.DataFrame({
'Product_ID':[101,102,103,104,105,106,107],
'Product_Name':['headphones','Bag','Shoes','Smartphone','Teeth brush','wrist watch','Laptop'],
'Category':['Electronics','Fashion','Fashion','Electronics','Grocery','Fashion','Electronics'],
'Price':[300.0,1000.50,2000.0,21999.0,145.0,1500.0,90999.0],
'Seller_City':['Islamabad','Lahore','Karachi','Rawalpindi','Islamabad','Karachi','Faisalabad']
})
customer=pd.DataFrame({
'ID':[1,2,3,4,5,6,7,8,9],
'Customer_Name':['Sara','Sana','Ali','Raees','Mahwish','Umar','Mirha','Asif','Maria'],
'Age':[20,21,15,10,31,52,15,18,16],
'Product_ID':[101,0,106,0,103,104,0,0,107],
'Product_Purchased':['headphones','NA','wrist watch','NA','Shoes','Smartphone','NA','NA','Laptop'],
'Customer_City':['Lahore','Islamabad','Faisalabad','Karachi','Karachi','Islamabad','Rawalpindi','Islamabad',
'Lahore']
})
print (pd.concat([product,customer]))

Conclusion:
In this article, we have discussed the implementation of merge () function, concat () functions, and joins operation in Pandas python. Using the above methods, you can easily join two DataFrames and learned. how to implement the Join operations “inner, outer, left, and right” in Pandas. Hopefully, this tutorial will guide you in implementing the join operations on different types of DataFrames. Please let us know about your difficulties in case of any error.
]]>QTimer Usage
The following sections provide examples that illustrate how to implement two different applications using the QTimer class.
Example 1: Create a Stopwatch
The following script will implement a stopwatch application in Python using the QTimer class. This application will count the number of seconds and the number of minutes. Two buttons are used to start, stop, resume, and reset the counter. When the user clicks the Start button, the counter will start counting, and the caption of the Start button will be changed to Stop. When the user clicks the Start button with the caption Stop, the counter will stop temporarily, and the caption of the Start button will be changed to Resume to continue the counter to the next time. When the user clicks the Reset button, all the values of the counter will be initialized to 0.
import sys
from PyQt5.QtWidgets import *
from PyQt5.QtCore import *
# Define class to create the stop watch
class StopWatchWindow(QMainWindow):
def __init__(self):
# Call the parent constructor
super().__init__()
# Set the title of the window
self.setWindowTitle("Stop Watch using QTimer")
# Set the geometry for the window
self.setGeometry(100, 100, 300, 200)
# Set the necessary variables
self.counter = 0
self.minute = '00'
self.second = '00'
self.count = '00'
self.startWatch = False
# Create label to display the watch
self.label = QLabel(self)
# Set geometry for the label
self.label.setGeometry(100, 40, 150, 70)
# Create start button
self.start = QPushButton("Start", self)
# Set geometry to the start button
self.start.setGeometry(50, 120, 100, 40)
# Call start() method when the start button is clicked
self.start.pressed.connect(self.Start)
# Create reset button
resetWatch = QPushButton("Reset", self)
# Set geometry to the stop button
resetWatch.setGeometry(160, 120, 100, 40)
# Call reset() method when the reset button is clicked
resetWatch.pressed.connect(self.Reset)
# Create timer object
timer = QTimer(self)
# Add a method with the timer
timer.timeout.connect(self.showCounter)
# Call start() method to modify the timer value
timer.start(100)
# Move the position of the window
self.move(900, 400)
# Display the window
self.show()
# Define a method to modify the values of minutes and seconds based on the timer value
def showCounter(self):
# Check the value of startWatch variable to start or stop the Stop Watch
if self.startWatch:
# Increment counter by 1
self.counter += 1
# Count and set the time counter value
cnt = int((self.counter/10 - int(self.counter/10))*10)
self.count = '0' + str(cnt)
# Set the second value
if int(self.counter/10) < 10 :
self.second = '0' + str(int(self.counter / 10))
else:
self.second = str(int(self.counter / 10))
# Set the minute value
if self.counter / 10 == 60.0 :
self.second == '00'
self.counter = 0
min = int(self.minute) + 1
if min < 10 :
self.minute = '0' + str(min)
else:
self.minute = str(min)
# Merge the mintue, second and count values
text = self.minute + ':' + self.second + ':' + self.count
# Display the stop watch values in the label
self.label.setText('<h1 style="color:blue">' + text + '</h1>')
# Define method to handle the start button
def Start(self):
# Set the caption of the start button based on previous caption
if self.start.text() == 'Stop':
self.start.setText('Resume')
self.startWatch = False
else:
# making startWatch to true
self.startWatch = True
self.start.setText('Stop')
# Define method to handle the reset button
def Reset(self):
self.startWatch = False
# Reset all counter variables
self.counter = 0
self.minute = '00'
self.second = '00'
self.count = '00'
# Set the initial values for the stop watch
self.label.setText(str(self.counter))
# Create app object and run the app
app = QApplication(sys.argv)
stopWt = StopWatchWindow()
app.exec()
The following window will appear after the above script is executed.

The stopwatch will start working after the user clicks the Start button.

The counter will stop counting after the user clicks the Stop button.

Example 2: Create A Digital Clock
The following script will implement a digital clock in Python using the QTimer class. The script will display the digital clock in a label by reading the current system time once every second.
import sys
from PyQt5.QtWidgets import QApplication, QWidget, QLabel, QVBoxLayout
from PyQt5.QtCore import QTimer, QTime, Qt
from PyQt5.QtGui import QFont
# Define class to create the digital clock
class DigitalClock(QWidget):
def __init__(self):
super().__init__()
# Create a label with font and alignment
self.lblTimer = QLabel()
font = QFont('Times', 50)
self.lblTimer.setFont(font)
self.lblTimer.setAlignment(Qt.AlignCenter)
# Create the vartical layout object
v_layout = QVBoxLayout()
v_layout.addWidget(self.lblTimer)
self.setLayout(v_layout)
# Create the timer object and call necessary methods to display the clock
timer = QTimer(self)
timer.timeout.connect(self.showClock)
timer.start(1000)
# Set the title of the window
self.setWindowTitle("Digital Clock using QTimer")
# Resize the window
self.resize(270, 120)
# Move the position of the window
self.move(800, 400)
# Call method to display the time
self.showClock()
# Display the window
self.show()
def showClock(self):
# Read the current time
Current_Time = QTime.currentTime()
# Display the digital clock
self.lblTimer.setText('<p style="color:green">' + Current_Time.toString('hh:mm:ss AP') + '</p>')
# Create app object and run the app
app = QApplication(sys.argv)
win = DigitalClock()
app.exec()
The following output window will appear after the above script is executed.

Conclusion
The date and time value of the current system time can be read in various ways using the QTimer class of the PyQt library. The QTimer class was used in this tutorial to execute various example time-related scripts.
]]>Necessary Methods
The QTableWidget class includes many methods to perform tasks related to table creation. Some of the more commonly used methods of this class are explained below:
| Method Name | Purpose |
|---|---|
| setRowCount() | Used to define the number of rows. |
| setColumnCount() | Used to define the number of columns. |
| setHorizontalHeaderLabels() | Used to set the header labels of the table. |
| setItem() | Used to set the cell value of the table. |
| resizeColumnsToContents() | Used to resize the columns of the table based on the content. |
| resizeRowsToContents() | Used to resize the rows of the table based on the content. |
| setMinimumWidth() | Used to set the minimum width of the table. |
| setMinimumHeight() | Used to set the minimum height of the table. |
| show() | Used to display the table. |
QTableWidget Usage
The following sections provide simple examples to explain how to create a table in the PyQt application using static data and list data.
Example 1: Create Simple Table Using Static Data
The following script creates a table of static data with five rows and four columns using the QTableWidget class. Two for loops with range values have been used in the script to add the static data into the table cells. The row and column positions of each cell have been added as the content of each cell. The QDesktopWidget is used in the script to display the window with the table in the center of the screen.
import sys
from PyQt5.QtWidgets import QApplication, QMainWindow, QTableWidget, QTableWidgetItem, QDesktopWidget
from PyQt5.QtCore import QSize
# Define class to create the table with static data
class SimpleTable(QMainWindow):
def __init__(self):
# Call the parent constructor
super().__init__()
# Set the size and title of the window
self.setMinimumSize(QSize(420, 150))
self.setWindowTitle("Simple Table with Static Data")
# Create the table with necessary properties
table = QTableWidget(self)
table.setColumnCount(4)
table.setRowCount(5)
table.setMinimumWidth(500)
table.setMinimumHeight(500)
# Set the table headers
table.setHorizontalHeaderLabels(["Header-1", "Header-2", "Header-3", "Header-4"])
# Set the table values
for i in range(5):
for j in range(4) :
table.setItem(i, j, QTableWidgetItem("Row-" + str(i+1) + " , Col-" + str(j+1)))
# Resize of the rows and columns based on the content
table.resizeColumnsToContents()
table.resizeRowsToContents()
# Display the table
table.show()
# Display the window in the center of the screen
win = self.frameGeometry()
pos = QDesktopWidget().availableGeometry().center()
win.moveCenter(pos)
self.move(win.topLeft())
self.show()
# Create app object and execute the app
app = QApplication(sys.argv)
mw = SimpleTable()
mw.show()
app.exec()
The following window with a table will appear the above script is executed. According to the values of the for loops, the cell value of the first row and the first column is ‘Row-1, Col-1,’ and the cell value of the last row and last column is ‘Row-5, Col-4.’
Example 2: Create Table with Tool-Tip Using Dictionary and List Data
The following script creates a table with the content of a Python dictionary and list using the QTableWidget class. The script also adds a tool-tip text for the table header. A Python dictionary named marks is also declared in the script. The course codes are used as the key values of the dictionary. A Python list is declared to define the student IDs. The key values of the dictionary are added to the header of the table, the values of the list are added to the first column of the table, and the values of the dictionary are added to the other columns of the table.
import sys
from PyQt5.QtWidgets import QApplication, QTableWidget, QTableWidgetItem, QDesktopWidget
# Declare a dictionary variable with marks
marks = {'CSE-401': [78, 93, 67, 88, 78],
'CSE-404': [90, 59, 82, 73, 89],
'CSE-406': [81, 80, 74, 83, 67],
'CSE-407': [81, 80, 98, 83, 72]}
class TableFromList(QTableWidget):
def __init__(self, data, *args):
# Call parent constructor
QTableWidget.__init__(self, *args)
# Declare a list of the student IDS
self.ID_list = ['0189945', '0154590', '0196734', '0185611', '0178956']
# Set the necessary configurations fot the table
self.data = data
self.resizeColumnsToContents()
self.resizeRowsToContents()
self.setColumnWidth(0, 100)
for i in range(4):
self.setColumnWidth(i, 80)
self.setMinimumWidth(400)
self.setWindowTitle("Mark Sheet")
# Declare the variable to set the header content
headers = []
headers.append('')
# for loop to read the keys of the dictionary
for n, key in enumerate(sorted(self.data.keys())):
headers.append(key)
# for loop to read the values of the dictionary
for m, item in enumerate(self.data[key]):
ID = QTableWidgetItem(self.ID_list[m])
self.setItem(m, 0, ID)
newVal = QTableWidgetItem(str(item))
self.setItem(m, n+1, newVal)
# Set the header label of the table
self.setHorizontalHeaderLabels(headers)
# Set the tooltips for the headers
self.horizontalHeaderItem(1).setToolTip("Multimedia ")
self.horizontalHeaderItem(2).setToolTip("Artificial Intelligent")
self.horizontalHeaderItem(3).setToolTip("Advanced Database")
self.horizontalHeaderItem(4).setToolTip("Unix Programming")
# Read the particular cell value
self.clicked.connect(self.on_click)
# Display the window in the center of the screen
win = self.frameGeometry()
pos = QDesktopWidget().availableGeometry().center()
win.moveCenter(pos)
self.move(win.topLeft())
self.show()
def on_click(self):
for ItemVal in self.selectedItems():
# Read the header value based on the selected cell
subject = self.horizontalHeaderItem(ItemVal.column()).text()
# Print the detail information of the mark
print("\n", self.ID_list[ItemVal.row()], " got ", ItemVal.text(), " in ", subject)
# Create app object and execute the app
app = QApplication(sys.argv)
table = TableFromList(marks, 5, 5)
table.show()
app.exec()
The following window with the table will appear after the above script is executed.
Conclusion
This tutorial showed you how to create tables with fixed data, dictionary data, and list data using two examples. Tables can also be created with dynamic data using database tables or other data sources.
]]>QPushButton Methods
The QPushButton class has many methods to perform various button-related tasks. Some of the more commonly used methods of this class are mentioned below:
| Method Name | Purpose |
|---|---|
| text() | Used to read the caption of the button. |
| setText() | Used to set text in the caption of the button. |
| setIcon() | Used to set an icon in the caption of the button. |
| setDefault() | Used to set the default button. |
| setEnabled() | Used to enable or disable buttons. A value of True is used to enable the button, and a value of False is used to disable the button. |
| setCheckable() | Used to identify whether the button is pressed or released. |
| isChecked() | Used to read the state of the button that is a boolean value. |
| toggle() | Used to toggle between states. If the current value of the button state is True, then the value will change to False, and vice versa. |
QPushButton Usage
The following sections provide several simple examples to explain the usage of QPushButton.
Example 1: Create A Simple Push Button
The following script is used to create a single button in the window. The script will attach a custom function with the clicked event of the button to check whether the button has been clicked. The window will display a button following the execution of the code. If the user clicks the button, the text ‘Button is pressed’ will show in the label.
import sys
from PyQt5.QtWidgets import QApplication, QWidget, QPushButton, QLabel
# Define class to create a single push button
class ButtonExample(QWidget):
def __init__(self):
# Call parent constructor
super().__init__()
# Create a button
self.btn = QPushButton('Click Me', self)
# Set tooltip text for the button
self.btn.setToolTip('This is a simple button')
# Set the geometry of the button
self.btn.setGeometry(100, 20, 100, 30)
# Call function when the button is clicked
self.btn.clicked.connect(self.onClicked)
# Define label at the bottom of the button
self.msgLabel = QLabel('', self)
# Set the geometry of the label
self.msgLabel.setGeometry(90, 60, 290, 60)
# Set the title of the window
self.setWindowTitle('Use of PushButton')
# Set the geometry of the main window
self.setGeometry(10, 10, 300, 150)
# Set the position of the main window in the screen
self.move(850, 300)
# Display the window
self.show()
# Define function to handle the click event of the button
def onClicked(self):
# Set text for the label
self.msgLabel.setText('Button is pressed.')
# Create app object and execute the app
app = QApplication(sys.argv)
button = ButtonExample()
app.exec()
The following window will appear after executing the script.
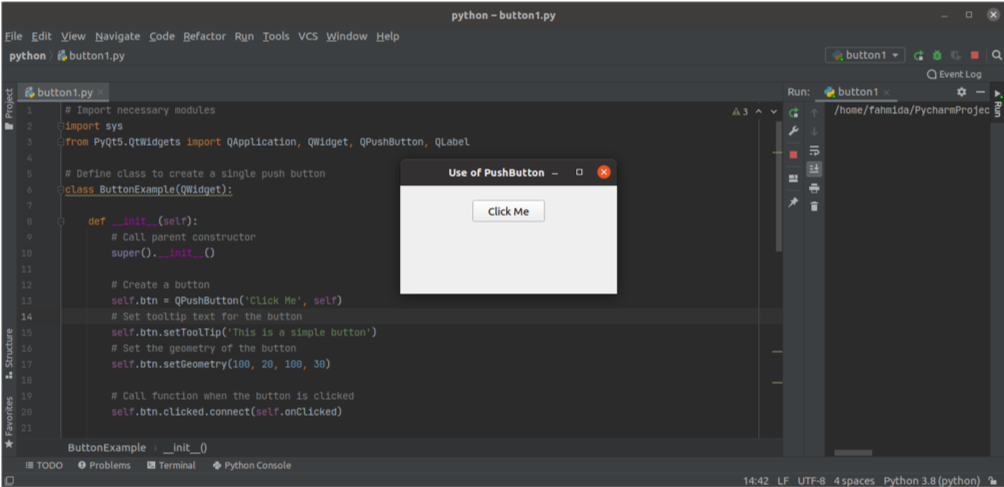
If the user clicks the Çlick Me button, then the following text will appear in the caption beneath the button.
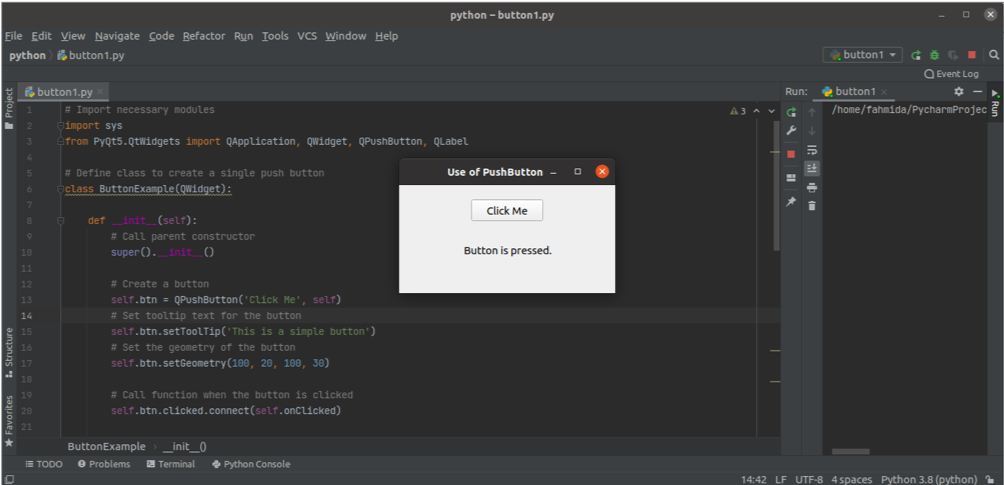
Example 2: Create Multiple Push Buttons
The following script will create multiple pushbuttons using the QPushButton class. Two buttons are created in the script. The clicked event of the ‘Yes’ button is attached to a method named btn1_onClicked(), and the clicked event of the ‘No’ button is attached to a method named btn2_onClicked(). A caption created below the buttons will display the specified message based on the button clicked by the user. The setGeometry() function is used for each label and button to set the position of the objects in the window.
from PyQt5.QtWidgets import QApplication, QWidget, QPushButton, QLabel
class MultiButtons(QWidget):
def __init__(self):
# Call parent constructor
super().__init__()
# Define label at the top of the button
self.topLabel = QLabel('<h2>Do you like python?</h2>', self)
# Set the geometry of the label
self.topLabel.setGeometry(100, 20, 290, 50)
# Create the first button
self.btn1 = QPushButton('Yes', self)
# Set the geometry of the button
self.btn1.setGeometry(130, 70, 60, 40)
# Call function when the button is clicked
self.btn1.clicked.connect(self.btn1_onClicked)
# Create the second button
self.btn2 = QPushButton('No', self)
# Set the geometry of the button
self.btn2.setGeometry(200, 70, 60, 40)
# Call function when the button is clicked
self.btn2.clicked.connect(self.btn2_onClicked)
# Define label at the bottom of the button
self.msgLabel = QLabel('', self)
# Set the geometry of the label
self.msgLabel.setGeometry(130, 120, 300, 80)
# Set the title of the window
self.setWindowTitle('Use of multiple PushButtons')
# Set the geometry of the main window
self.setGeometry(10, 10, 400, 200)
# Set the position of the main window in the screen
self.move(850, 300)
# Display the window
self.show()
def btn1_onClicked(self):
# Set text for the bottom label
self.msgLabel.setText('<h3>You clicked Yes.</h3>')
def btn2_onClicked(self):
# Set text for the bottom label
self.msgLabel.setText('<h3>You clicked No.</h3>')
# Create app object and execute the app
app = QApplication(sys.argv)
button = MultiButtons()
app.exec()
The following window will appear after executing the script.
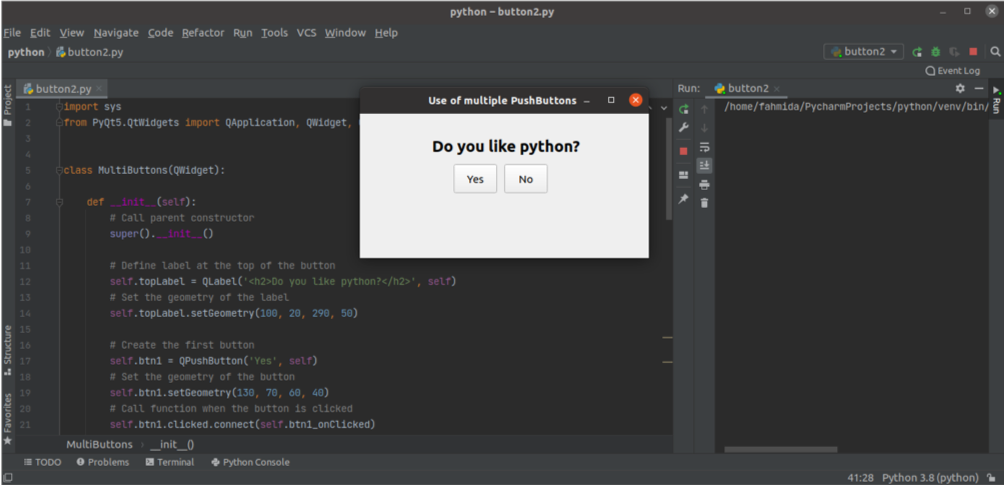
If the user clicks the Yes button, the message, ‘You clicked Yes’ will be displayed as the label text.
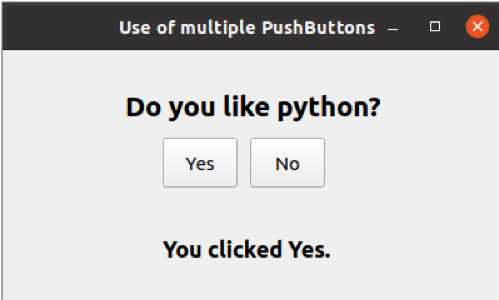
If the user clicks the No button, the message, ‘You clicked No’ will be displayed as the label text.

Conclusion
The QPushButton class allows users to create one or more buttons based on the application requirements. This tutorial showed the usage of this class for creating one or multiple buttons, as well as how to handle click events of buttons using custom event handler functions.
]]>Necessary Methods
The QMessageBox class has many methods for creating various types of message boxes. Some of the more commonly used methods of the QMessageBox class are described below:
| Method Names | Purpose |
|---|---|
| setTitle() | Used to display the custom title. |
| setText() | Used to set the text of the main message. |
| setDetailText() | Used to display a window with a details button; the message text will appear after the user clicks on the button. |
| setInformativeText | Used to display the additional message. |
| setIcon() | Used to set an icon in the message box based on the message type. |
| setWindowTitle() | Used to set the title of the message window. |
| setDefaultButton() | Used to set the button in the message box default; the button will release a clicked signal when the Enter key is pressed. |
| setEscapeButton() | Used to set any button to work as an escape key; the button will release a clicked signal when the Escape key is pressed. |
| setStandardButtons() | Various standard buttons can be used in the message box based on the message type, such as OK, Yes, No, Cancel, Close, etc. |
QMessageBox Usage
The following sections of this tutorial provide examples that will show you how to create different message boxes using the QMessageBox class.
Example 1: Create an Informational Message Box
The following script will create a simple informational message box using the QMessageBox class. This type of message box provides the informational message for the user only. OK is the default button in the message box. Here, QMessageBox.Information is used in the setIcon() method to display the information icon in the message box.
import sys
from PyQt5.QtWidgets import QApplication, QMainWindow, QMessageBox
# Define class to to display an informational message
class MessageWindow(QMainWindow):
def __init__(self):
# Call the parent constructor
super().__init__()
# Create the messagebox object
self.msg = QMessageBox()
# Set the information icon
self.msg.setIcon(QMessageBox.Information)
# Set the main message
self.msg.setText("The task is completed successfully.")
# Set the title of the window
self.msg.setWindowTitle("Informational Message")
# Display the message box
self.msg.show()
# Create app object and run the app
app = QApplication(sys.argv)
Win = MessageWindow()
app.exec()
The following message box will appear after the above script is executed.

Example 2: Create a Warning Message Box
The following script will create the warning message box using the QMessageBox class. This type of message box provides the warning message for the user. The warning is used in the setIcon() method to display the warning icon in the message box. The OK and Cancel buttons are added to the message box using the setStandardButtons() method. A custom method called msgButton() is defined in the class to trace the button in the message box that has been clicked by the user. If the user clicks the OK button, then the text, ‘OK button is pressed,’ will print; otherwise, the ‘Cancel button is pressed’ text will print.
import sys
from PyQt5.QtWidgets import QApplication, QMainWindow, QMessageBox
# Define class to to display an informational message
class MessageWindow(QMainWindow):
def __init__(self):
# Call the parent constructor
super().__init__()
# Create the messagebox object
self.msgWarning = QMessageBox()
# Set the Warning icon
self.msgWarning.setIcon(QMessageBox.Warning)
# Set the main message
self.msgWarning.setText("<b>Name</b> variable is undefined.")
# Set two buttons for the message box
self.msgWarning.setStandardButtons(QMessageBox.Ok | QMessageBox.Cancel)
# Call the custom method on button clicked
self.msgWarning.buttonClicked.connect(self.msgButton)
# Set the title of the window
self.msgWarning.setWindowTitle("Warning Message")
# Display the message box
self.msgWarning.show()
# Define function for the buttons
def msgButton(self, i):
if i.text() == '&OK' :
print("OK Button is pressed.")
else:
print("Cancel Button is pressed.")
# Create app object and run the app
app = QApplication(sys.argv)
Win = MessageWindow()
app.exec_()
The following message box will appear after the above script is executed.
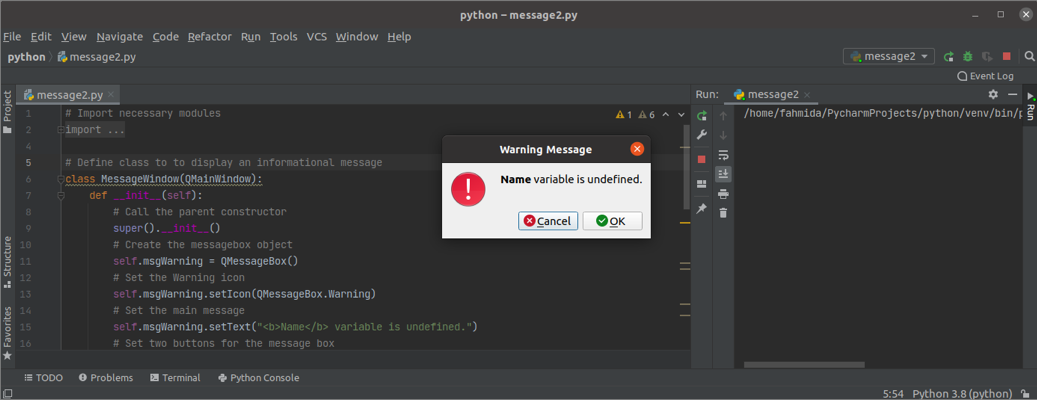
If the user clicks the OK button, the following output will appear.
Example 3: Create a Question Warning Message
The following script will create the question message box using the QMessageBox class. This type of message box provides the question message for the user to take the particular action based on the user’s decision. Here, QMessageBox.Question is used in the setIcon() method to display the question icon in the message box. The Yes and No buttons are added to the message box using the setStandardButtons() method. The No button is set as the default button using the setDefaultButton() method. A custom method called msgButton() is defined in the class to trace the button in the message box that has been clicked by the user.
import sys
from PyQt5.QtWidgets import QApplication, QMainWindow, QMessageBox
# Define class to to display an informational message
class MessageWindow(QMainWindow):
def __init__(self):
# Call the parent constructor
super().__init__()
# Create the messagebox object
self.msgQuestion = QMessageBox()
# Set the Warning icon
self.msgQuestion.setIcon(QMessageBox.Question)
# Set the main message
self.msgQuestion.setText("Do you want to continue?")
# Set two buttons for the message box
self.msgQuestion.setStandardButtons(QMessageBox.Yes | QMessageBox.No)
self.msgQuestion.setDefaultButton(QMessageBox.No)
# Call the custom method on button clicked
self.msgQuestion.buttonClicked.connect(self.msgButton)
# Set the title of the window
self.msgQuestion.setWindowTitle("Asking Question to user")
# Display the message box
self.msgQuestion.show()
# Define function for the buttons
def msgButton(self, i):
if i.text() == '&Yes' :
print("The task is continuing...")
else:
print("You have cancelled the task.")
# Create app object and run the app
app = QApplication(sys.argv)
Win = MessageWindow()
app.exec_()
The following message box will appear after the above script is executed.
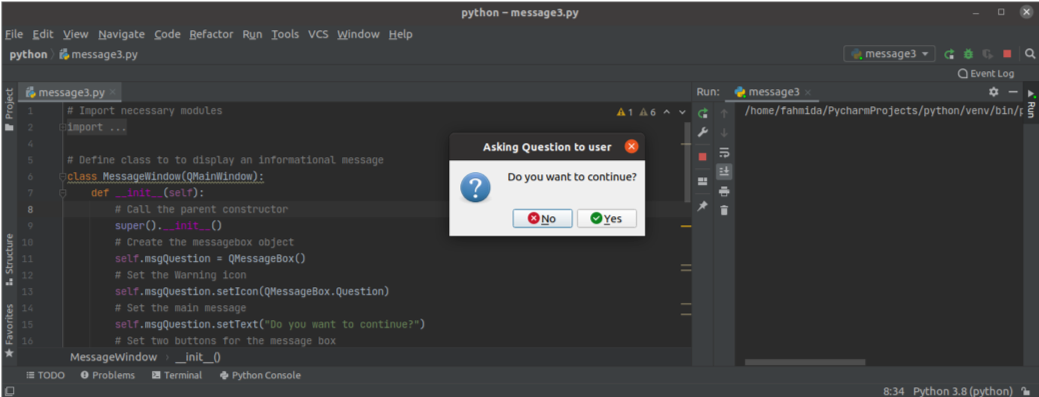
If the user clicks the Enter key without selecting any buttons, then the No button will be activated by default, and the following output will appear:
Conclusion
In this tutorial, three different types of message boxes were created using the QMessageBox class. Hopefully, this tutorial helped you to better understand the usage of this class. You should now be able to create a message box for the PyQt application.
]]>A ComboBox is used to select one item from a list of items, much like the radio button. The QComboBox class of PyQt is used to create drop-down lists using Python script. It brings up a list of items for the user to select. The items of the ComboBox can be added, changed, and removed using the script. Multiple items can be selected like the CheckBox button from the list of items from the ComboBox then it is called ListBox. This tutorial shows you how to use QComboBox to create a drop-down list in Python.
QComboBox Methods
The QComboBox class contains many methods for performing various tasks related to ComboBox. Some of the more commonly used methods of this class are described below:
| Method Name | Purpose |
|---|---|
| count() | Used to count the total number of items in the list. |
| addItem() | Used to add a single new item to the list. |
| addItems() | Used to add multiple items to the list. |
| itemText() | Used to read the text of a particular item based on an index. |
| setItemText() | Used to set the text of a particular item based on an index. |
| currentText() | Used to read the text of the selected item. |
| currentIndex() | Used to read the index of the selected item. |
| clear() | Used to delete all items from the list. |
| highlighted() | Used when an item in the list is highlighted. |
| activated() | Used when an item is selected by the user. |
| currentIndexChanged() | Used when the item in the list has changed. |
ComboBox Usage
The following sections provide examples that explain some different uses of the ComboBox using the QComboBox module of the PyQt library.
Example 1: Create a Simple Drop-Down List
This example shows you how to create a simple drop-down list using the QComboBox class. Here, a drop-down list of five elements is created and is attached to a custom function that will print the selected value from the list. One label is used in the function of the drop-down list to display static text, and another label is used below the drop-down list to show the selected value.
import sys
from PyQt5.QtWidgets import (QApplication, QWidget, QLabel, QVBoxLayout, QComboBox)
# Declare class to create the ComboBox
class ComboExample(QWidget):
def __init__(self):
super().__init__()
# Set the label before the ComboBox
self.topLabel = QLabel('Select your favorite programming language:', self)
# Define the combobox with items
combobox = QComboBox(self)
combobox.addItem('PHP')
combobox.addItem('Python')
combobox.addItem('Perl')
combobox.addItem('Bash')
combobox.addItem('Java')
# Set the label after the ComboBox
self.bottomLabel = QLabel('', self)
self.bottomLabel.adjustSize()
# Define vartical layout box
v_layout = QVBoxLayout()
v_layout.addWidget(self.topLabel)
v_layout.addWidget(combobox)
v_layout.addWidget(self.bottomLabel)
# Call the custom method if any item is selected
combobox.activated[str].connect(self.onSelected)
# Set the configurations for the window
self.setContentsMargins(20, 20, 20, 20)
self.setLayout(v_layout)
self.move(800, 300)
self.setWindowTitle('Use of ComboBox')
# Custom function to read the value of the selected item
def onSelected(self, txtVal):
txtVal = "\nYou have selected: " + txtVal
self.bottomLabel.setText(txtVal)
# Create app object and execute the app
app = QApplication(sys.argv)
combobox = ComboExample()
combobox.show()
app.exec()
If the user clicks on the drop-down list after executing the script, the following list will appear.

If the user selects the value Bash from the drop-down list, the value of the second label will be changed to ‘You have selected: Bash.’
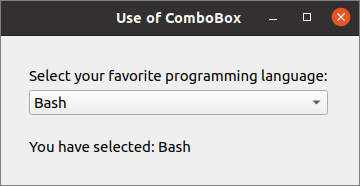
Example 2: Create a ComboBox Using the List
In the previous example, the drop-down list was created with static data using the addItem() method of the QComboBox class. This example shows you how to add multiple items in the drop-down list by defining a Python list. First, we will add static text to the first item of the drop-down list using the addItem() method. Next, we will define a list of five elements in the script, and we will add these elements to the drop-down list using the addItems() method. A custom function is attached to the drop-down list to display the message in the label based on the user selection.
import sys
from PyQt5.QtWidgets import *
# Declare the class to create combobox by using list data
class ComboExample(QMainWindow):
def __init__(self):
super().__init__()
# Set the tittle of the window
self.setWindowTitle("ComboBox with List data ")
# Set the geometry for the window
self.setGeometry(100, 100, 350, 150)
# Create combobox
self.combobox = QComboBox(self)
# Set the geometry for the combobox
self.combobox.setGeometry(30, 30, 200, 30)
# Define list items for the combobox
src_engines = ["google.com", "yahoo.com", "ask.com", "baidu.com", "yandex.com"]
# Enable the editable option of the combobox
self.combobox.setEditable(True)
# Set the first item for the combobox
self.combobox.addItem("Select Search Engine")
# Add multiple items in the combobox using list
self.combobox.addItems(src_engines)
# Define label at the bottom of the combobox to provide message for the user
self.msgLabel = QLabel('', self)
# Set the geometry for the label
self.msgLabel.setGeometry(30, 60, 290, 60)
# Call the custom function when any item is selected
self.combobox.activated[str].connect(self.onClicked)
# Move the position of the window
self.move(800, 400)
# Display the Window
self.show()
# Define a method to handle the click event of the Combobox
def onClicked(self, val):
# Check any item is selected by the user or not
if val == "Select Search Engine":
message = "You have selected nothing."
else:
message = "Your favorite search engine is " + val
# Display the message text in the label
self.msgLabel.setText(message)
# Display the message in the console
print(message)
# Create the app object
app = QApplication(sys.argv)
# Create an object of the class object
combo = ComboExample()
# Execute the app
app.exec()
If the user clicks the drop-down list after executing the script, then the following list will appear.
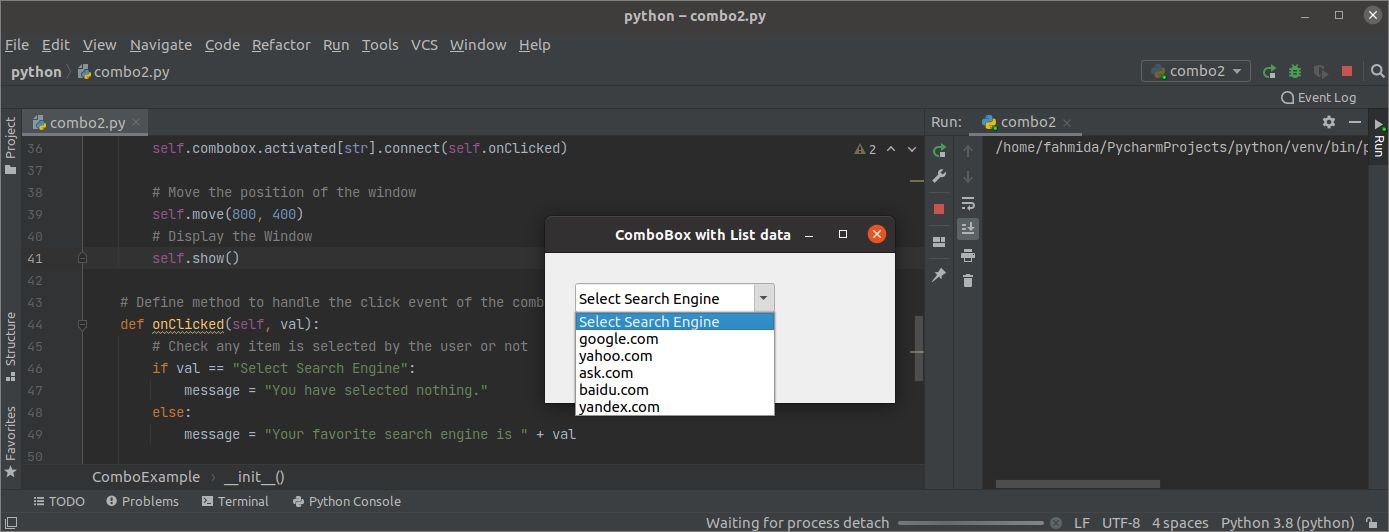
If the user selects any item except the first item in the drop-down list, then the selected value will be shown in the label by combining with the other text.
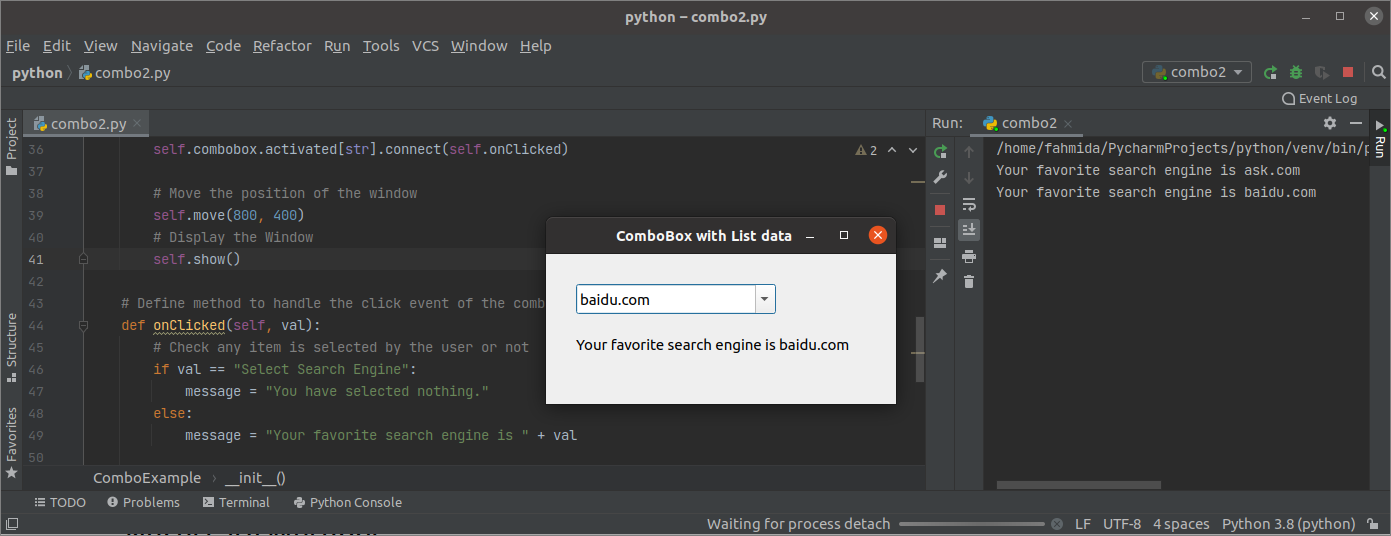
If the user selects the first item in the drop-down list, then the value, ‘You have selected nothing’ will be shown in the label.

Conclusion
This article showed you how to create and use drop-down lists in Python using the QComboBox class using simple examples to help you to better understand the use of this class.
]]>PyQt is a popular Python library used to implement graphical applications in Python more easily. This library comes with a GUI (Graphical User Interface) builder tool called Qt Designer. The GUI can be built quickly in Python using the drag-and-drop feature of this library, though this tool has no debugging facility like the standard IDE. This tutorial shows you how to implement the GUI using the Qt Designer class of PyQt.
Prerequisites
You must install the Qt Designer tool before practicing the examples provided in this tutorial. Run the following commands to install the Qt Designer on your system:
$ sudo apt-get install qttools5-dev
Open the Qt Designer
Run the following command to change the current directory location to the Qt Designer folder.
Run the following command to open the Qt Designer application.
If the Qt Designer has been installed properly, the following window will appear. The Widget box shown on the left side of the main window contains various widgets that you can use to design the user interface of the application. The New Form window is used to create a new window using the default buttons. The windows shown on the right side of the main window provides information about the widgets that can be read or modified.
Create the First Form Using the Qt Designer
To begin designing the interface for the Python application, we will click the Create button in the following window to open the dialog box with two default buttons.
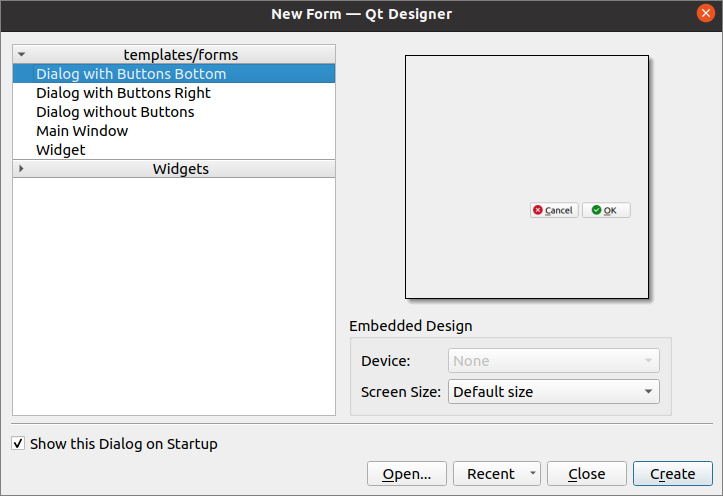
Next, we will design a login form using the Label, Text Edit, and Push Button widgets. The dialog box will be saved with the name Login.ui, which will be used later in the Python script. The QObject name will be changed to Logindialog using the Property Editor Window of this application.

Using the Login Dialog Box
The user interface file created by the Qt Designer can be used in the Python script in two ways. The file can be used directly in the Python script, or the converted Python file of the Qt Designer file can be used in the Python script. Both ways of using the dialog box of Qt Designer are shown in the following section of the tutorial.
Run Qt Designer File Directly
The UIC module of the PyQt library is used to load the file created by the Qt Designer, and the loadUI() method of the UIC module is used to load the UI file. The following script shows how to load the Qt Designer file named Login.ui that we created before. The necessary modules are imported at the beginning of the script. The object of the application is created using the QApplication(), and the Qt Designer file is loaded using the loadUI() method. Next, the exec() method is called to start the event loop of the application.
import sys
# Import QtWidgets and uic modules
from PyQt5 import QtWidgets, uic
# Create app object
app = QtWidgets.QApplication(sys.argv)
# Load GUI form and display
window = uic.loadUi("Login.ui")
window.show()
# Start the event loop of the app or dialog box
app.exec()
The following dialog box will appear after executing the above script.
Run UI File by Converting into Python File
The UI file created by the Qt Designer can be converted into a Python file using the pyuic5 command. Run the following command to convert the Login.ui file into the loginForm.py file. The Login.ui file must be stored in the current location to run the following command; otherwise, an error will be generated.
The following code will be generated in the loginForm.py file after executing the above command.
# Form implementation generated from reading ui file 'Login.ui'
#
# Created by: PyQt5 UI code generator 5.12.3
#
# WARNING! All changes made in this file will be lost!
from PyQt5 import QtCore, QtGui, QtWidgets
class Ui_Logindialog(object):
def setupUi(self, Logindialog):
Logindialog.setObjectName("Logindialog")
Logindialog.resize(400, 224)
self.textEdit = QtWidgets.QTextEdit(Logindialog)
self.textEdit.setGeometry(QtCore.QRect(130, 70, 221, 31))
self.textEdit.setObjectName("textEdit")
self.textEdit_2 = QtWidgets.QTextEdit(Logindialog)
self.textEdit_2.setGeometry(QtCore.QRect(130, 120, 221, 31))
self.textEdit_2.setObjectName("textEdit_2")
self.label = QtWidgets.QLabel(Logindialog)
self.label.setGeometry(QtCore.QRect(140, 20, 131, 31))
font = QtGui.QFont()
font.setPointSize(18)
self.label.setFont(font)
self.label.setObjectName("label")
self.label_2 = QtWidgets.QLabel(Logindialog)
self.label_2.setGeometry(QtCore.QRect(36, 70, 81, 20))
self.label_2.setObjectName("label_2")
self.label_3 = QtWidgets.QLabel(Logindialog)
self.label_3.setGeometry(QtCore.QRect(40, 120, 67, 17))
self.label_3.setObjectName("label_3")
self.btnLogin = QtWidgets.QPushButton(Logindialog)
self.btnLogin.setGeometry(QtCore.QRect(150, 170, 89, 25))
self.btnLogin.setObjectName("btnLogin")
self.btnCancel = QtWidgets.QPushButton(Logindialog)
self.btnCancel.setGeometry(QtCore.QRect(250, 170, 89, 25))
self.btnCancel.setObjectName("btnCancel")
self.retranslateUi(Logindialog)
QtCore.QMetaObject.connectSlotsByName(Logindialog)
def retranslateUi(self, Logindialog):
_translate = QtCore.QCoreApplication.translate
Logindialog.setWindowTitle(_translate("Logindialog", "Dialog"))
self.label.setText(_translate("Logindialog", "Login Form"))
self.label_2.setText(_translate("Logindialog", "Username"))
self.label_3.setText(_translate("Logindialog", "Password"))
self.btnLogin.setText(_translate("Logindialog", "Login"))
self.btnCancel.setText(_translate("Logindialog", "Cancel"))
The following will display the Login dialog box by importing the loginForm.py file created using the pyuic5 command. The object of the application is created using QApplication(), and the Login dialog box is loaded using the setupUi() method. The Login button is attached with the loginClicked() method to check whether the username and password taken from the user are valid. The Cancel button is attached to the cancelClicked() method to quit from application. The exec() method is called to start the event loop of the application.
from PyQt5 import QtWidgets
# Import sys
import sys
# Import login form ui
import loginForm
# Define a class to setup the UI
class MyApp (QtWidgets.QMainWindow, loginForm.Ui_Logindialog):
def __init__(self, parent=None):
super(MyApp, self).__init__(parent)
# Load the login form
self.setupUi(self)
# Call loginClicked() method
self.btnLogin.clicked.connect(self.loginClicked)
# Call cancelClicked() method
self.btnCancel.clicked.connect(self.cancelClicked)
# Declare method to check username and password when Login button will click
def loginClicked(self):
if self.textEdit.toPlainText() == 'admin' and self.textEdit_2.toPlainText() == 'superuser':
print('Authenticated User')
else:
print('Unauthenticated User')
# Declare method to terminate the script when Cancel button will click
def cancelClicked(self):
exit()
# Create app object
app = QtWidgets.QApplication(sys.argv)
# Create class object
form = MyApp()
# Display the form
form.show()
# Start the event loop of the app or dialog box
app.exec()
The following dialog box will appear after executing the above script.
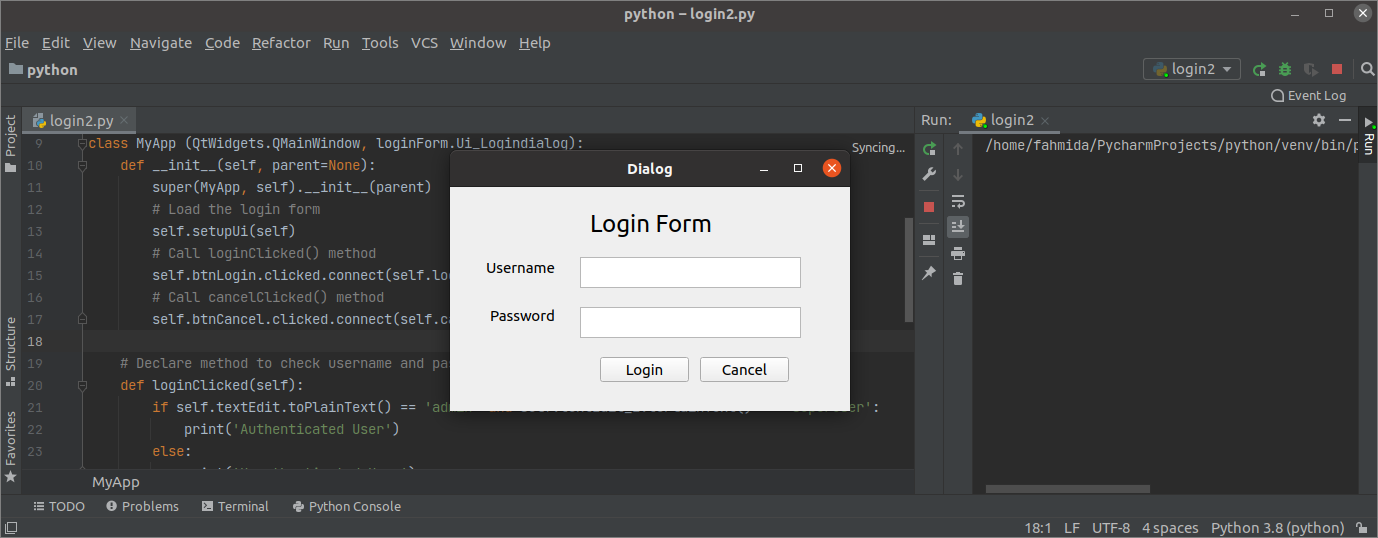
If the user enters the wrong username or password in the Login form, then the following output will appear after clicking the Login button.

If the user enters the correct username and password in the Login form, then the following output will appear after clicking on the Login button.
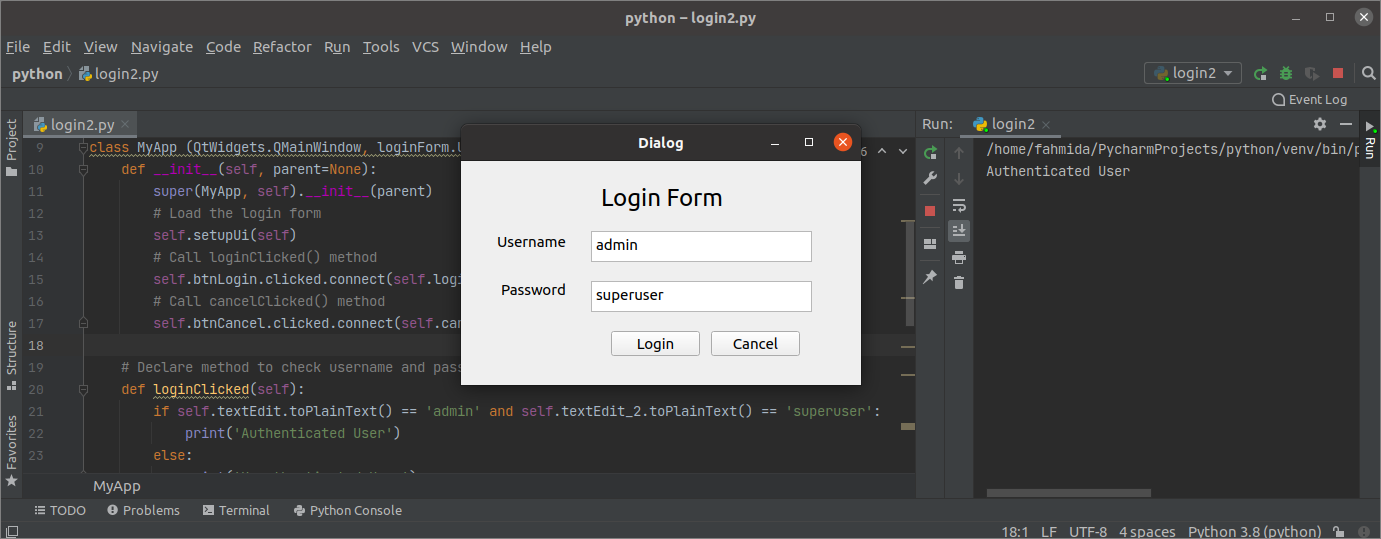
If the user clicks the Cancel button in the Login form, then the dialog box will disappear.
Conclusion
This tutorial showed you how to install Qt Designer and how to design a simple form using this application. The tutorial also showed you how to load the UI dialog box directly and after converting it into the Python script have shown in the other part of this tutorial. Hopefully, this article helped you to better understand the usage of Qt Designer for building and using the GUI in applications.
]]>Create a Simple PyQt Application for Addition:
The steps of implementing a simple PyQt application to calculate the sum of two numbers are shown in this section of the tutorial. Here, the number values will be taken from the user using textboxes, after executing the script, then the sum of the values will be displayed after clicking a button. A window with the necessary fields has been created here to build the design of the application; next, the Python script is used to calculate the sum.
Steps:
Step 1. Create PyQt application object
You have to import the required modules of Python to design the PyQt application of this tutorial. To design this application, it will require two labels, two text boxes, and a push-button.
QApplication, QMainWindow, QLabel, QTextEdit, and QPushButton modules will be required to design the application.
Add the following lines at the beginning of the script to use these modules.
from PyQt5.QtWidgets import QApplication, QMainWindow, QLabel, QTextEdit, QPushButton
Add the following lines to create the application object and start the event loop. Nothing will appear after executing the script now.
app = QApplication([])
# Start the event loop for executing the application
app.exec()

Step 2: Create class and window object
Create the class to add the necessary objects in this step to design the application window.
Add the following lines to create a class with a window object. Here, the title, size, and position of the window are set. Next, the show() method is called to display the window as output.
def __init__(self):
# Call the parent constructor
super().__init__()
# Set the title of the window
self.setWindowTitle("PyQt Addition Application")
# Set the width and height of the window
self.resize(350, 200)
# Move the position of the window
self.move(800, 400)
# Display the window
self.show()
You have to create the object of the class before running the event loop.
window = addition()
The following blank window will appear after executing the script.

Step 3: Add necessary widgets in the window for addition
Now, add the necessary objects required to implement the application. The three objects of the QLabel widget, two objects of the QTextEdit widget, and a button object of the QPushButton widget are created in this step. The first two label objects will be used to provide the helping text before the textboxes. QTextEdit objects will be used to take two number values from the user. QPushButton object will be created to calculate the sum of the input numbers using an event handler function that will be created in the next step. The last label object will be used to display the summation of the two numbers. Here, the setGeometry() function is called for every object to set the position of the object in the window.
self.lbl1 = QLabel('Number 1', self)
self.lbl1.setGeometry(80, 20, 80, 50)
# Create textbox for the first number
self.textbox1 = QTextEdit(self)
self.textbox1.setGeometry(80, 60, 70, 30)
# Create label for the second number
self.lbl2 = QLabel('Number 2', self)
self.lbl2.setGeometry(200, 20, 80, 50)
# Create textbox for the second number
self.textbox2 = QTextEdit(self)
self.textbox2.setGeometry(200, 60, 70, 30)
# Create push button for calculate the sum
self.submit = QPushButton('Calculate Sum', self)
self.submit.setGeometry(80, 100, 190, 30)
# Create label for show the result of summation
self.lblResult = QLabel('', self)
self.lblResult.setGeometry(80, 130, 200, 50)
The following output will appear after executing the script. No event handler function is created in this step, which is used to calculate the sum of the numbers. So, if the user clicks the button, nothing will happen.

Step 4: Create and call the function to handle the click event of the button
Create a method named onClicked() with the following lines inside the addition class to handle the click event of the button. The values of the textboxes are converted into integer numbers using the int() function and stored into the num1 and num2 variables. Next, the sum of num1 and num2 are stored in the result variable. The values of num1, num2, and result variables are converted into string values using the str() function, before storing the values in the output variable. The third label object is used to display the content of the output variable.
num1 = int(self.textbox1.toPlainText())
num2 = int(self.textbox2.toPlainText())
result = num1 + num2
output = "<p style='color:blue'>The sum of " + str(num1) + " and " + str(num2) + " is " + str(result) + '</p>'
self.lblResult.setText(output)
Add the following lines in the class after the button object to call onClicked() method when the button will be clicked.
self.submit.clicked.connect(self.onClicked)
After executing the script, if the user entered 12 and 18 in the textboxes and clicked on the Calculate Sum button, and the following formatted output will appear below the button.

Conclusion:
The implementation of a very simple PyQt application has been explained in this tutorial starting from the basic to help the new Python users. Hopefully, the user will be able to design and create a simple PyQt application after completing and understanding the steps of this tutorial properly.
]]>The scientific or numerical visualization tasks can be done in python easily using various Python libraries, such as Plotly, Matplotlib, Seaborn, ggplot, PyQt, etc. PyQtGraph is a useful module of the PyQt library to create a graph. This module can create graphs very fast. 2D and 3D graphics can be created by using this module. How to use the PyQtGraph module to draw different types of graphs has shown in this tutorial.
Prerequisites
You have to install the PyQtGraph module in your system before creating the graph. Run the following command to install PyQtGraph by using pip3.
Draw Line Graph
A line chart or line graph is a chart that displays information by using a series of data plots. PlotWidget widget is used to create all plots of PyQtGraph. This widget contains a canvas on which any plot can be added or removed.
Example-1: Draw a simple line graph
The following script shows the way to draw a line graph using random numbers. range() function is used to generate 10 sequential numbers that are used for x-axis values. The random module of python is used to generate 10 random integer numbers used for y-axis values. plot() method is used to draw each plot of the line graph based on the values of the x-axis and y-axis. When the code is executed in interactive mode, then sys.flags.interactive flag will be True. If this flag’s value is not True, then it indicates that the Qt event loop does not require to run because the REPL (Run, Evaluate, Print, Loop) already has an event loop.
# Import random module
import random as rd
# Import PyQtGraph Module
import pyqtgraph as pg
# Import QtGui from the PyQtGraph Module
from pyqtgraph.Qt import QtGui
# Generate x-axis values
x = range(0, 10)
# Generate y-axis values
y = [ ]
for i in range(0, 10):
n = rd.randint(0, 20)
y.append(n)
# Initialize the plot
plt = pg.plot()
# Set the label for x axis
plt.setLabel('bottom', 'Sequentially Generated Values')
# Set the label for y-axis
plt.setLabel('left', 'Randomly Generated Values')
# Set horizontal range
plt.setXRange(0, 10)
# Set vertical range
plt.setYRange(0, 20)
# Set the title of the graph
plt.setTitle("Simple Line Graph")
# Set the plot values
line = plt.plot(x, y)
# Main method
if __name__ == '__main__':
# Import sys module
import sys
# Start Qt event loop unless running in interactive mode
if sys.flags.interactive != 1:
QtGui.QApplication.instance().exec()
Output:
The following similar line graph will be appeared after executing the above script. The graph will vary in each execution for the random values.
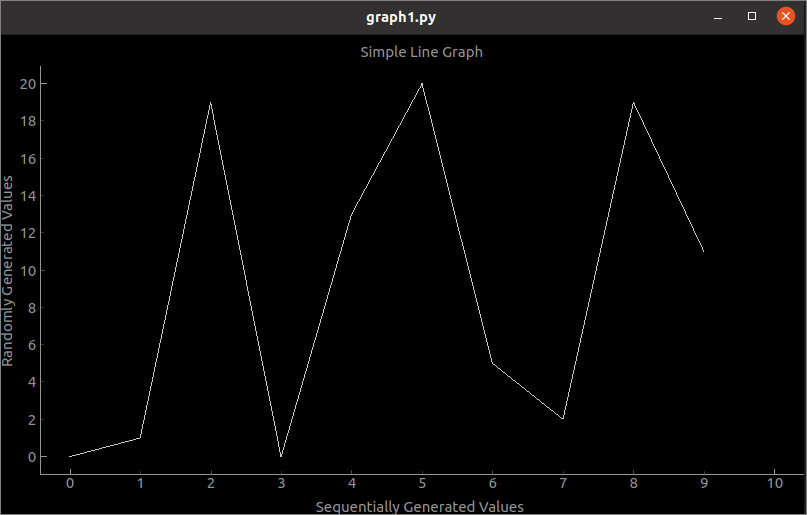
Example-2: Draw a Line graph with styling and marker
The following script shows how to draw a stylist line graph based on the values of a python list. mkPen() function is used to set the color and width of the line. ‘o‘ is used as the marker in the graph, and the color and width of the marker are set by using symbolPen and symbolSize properties.
# Import PyQtGraph Module
import pyqtgraph as pg
# Import QtGui from the PyQtGraph Module
from pyqtgraph.Qt import QtGui
# Generate x-axis values
x = range(0, 10)
# Generate y-axis values
y = [3, 7, 5, 11, 8, 13, 9, 16, 15, 12]
# Initialize the plot
plt = pg.plot()
# Set the label for x axis
plt.setLabel('bottom', 'X-axis Values')
# Set the label for y-axis
plt.setLabel('left', 'Y-axis Values')
# Set horizontal range
plt.setXRange(0, 10)
# Set vertical range
plt.setYRange(0, 20)
# Set the title of the graph
plt.setTitle("Line Graph with styling and marker")
# Set the background color
plt.setBackground('d5ecf2')
# Set the plot values with pen color and width
line = plt.plot(x, y, pen=pg.mkPen('r', width=6), symbol='o', symbolPen='b', symbolSize=20)
# Add legend
plt.addLegend()
# Show grids
plt.showGrid(x=True, y=True)
# Main method
if __name__ == '__main__':
# Import sys module
import sys
# Start Qt event loop unless running in interactive mode
if sys.flags.interactive != 1:
QtGui.QApplication.instance().exec_()
# Main method
if __name__ == '__main__':
# Import sys module
import sys
# Start Qt event loop unless running in interactive mode
if sys.flags.interactive != 1:
QtGui.QApplication.instance().exec_()
Output:
The following line graph will be appeared after executing the above script.
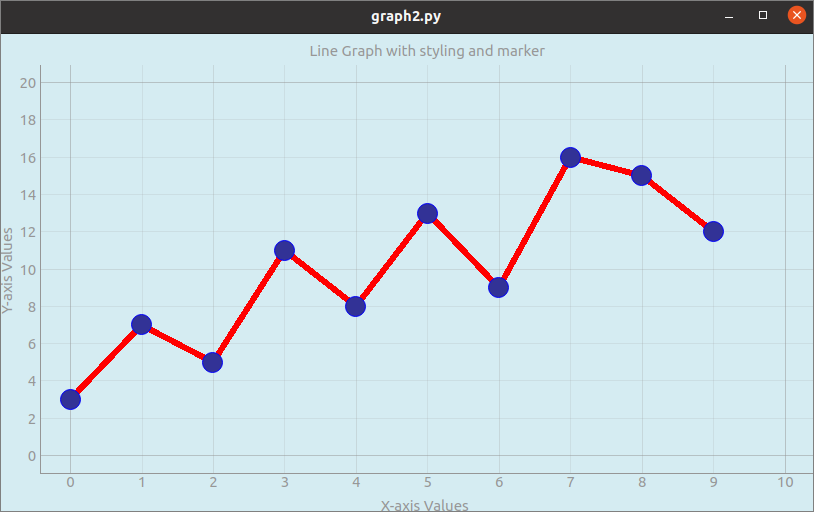
Draw Bar Graph
A set of data can be visualized by using a bar graph. A simple bar creates by comparing the list of data with a related range of data. BarGraphItem class is used to create the bar graph by using PyQtGraph.
Example-3: Draw a bar graph
The following script shows how to draw a bar graph based on the values of a NumPy array. BarGraphItem is used to draw a bar graph with blue color and a width value of 0.5.
# Import PyQtGraph module
import pyqtgraph as pg
# Import QtGui from the PyQtGraph Module
from pyqtgraph.Qt import QtGui
# Import NumPy Library
import numpy as np
# Generate x-axis
x = np.arange(0, 10)
# Generate y-axis
y = np.array([3, 5, 7, 9, 5, 8, 10, 6, 5, 2])
# Set bar chart values and brush color and width
bg = pg.BarGraphItem(x=x, height=y, width=0.5, brush='b')
# Define the plot variable
plt = pg.plot()
# Set the label for x axis
plt.setLabel('bottom', '<p style="font-size:20px;color:green">X-axis Values</p>')
# Set the label for y-axis
plt.setLabel('left', '<p style="font-size:20px;color:green">Y-axis Values</p>')
# Set the bar title
plt.setTitle('<h3>Bar Graph using PyQtGraph</h3>')
# Add the bar chart items
plt.addItem(bg)
# Main method
if __name__ == '__main__':
# Import sys module
import sys
# Start Qt event loop unless running in interactive mode
if sys.flags.interactive != 1:
QtGui.QApplication.instance().exec_()
Output:
The following bar graph will be appeared after executing the above script.
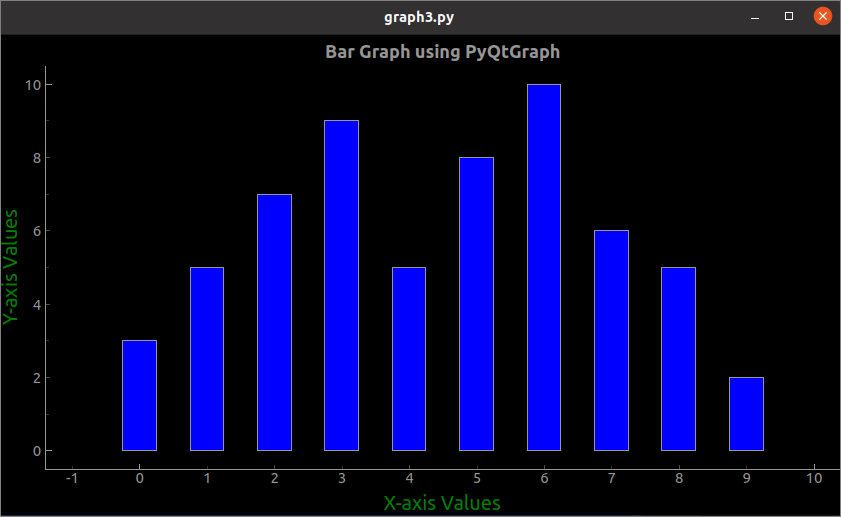
Conclusion
Creating three different types of graphs with random values, list items, and NumPy array have shown in this tutorial by using three simple examples. The readers will be able to use the PyQtGraph module for implementing line and bar graphs after reading this tutorial.
]]>The checkbox is used to select zero or more options from many options using the graphical user interface. A form with a checkbox can be created by using QCheckBox class in a Python script or using the QCheckBox widget of Qt Designer without writing any script.
When a form with a checkbox is created using QCheckBox class, then stateChanged.connect() function is called to apply the action done by the user’s input. If the user checked any checkbox option, then the value of QtCore.Qt.checked will be True. Multiple checkboxes with a single selection like Radio Button can be created using QbuttonGroup class.
How a form with a checkbox can be created by writing a Python script is shown in this tutorial.
Necessary methods of QCheckBox
QCheckBox class has many functions to do different types of tasks with the checkbox. Some most commonly used methods of this class are described below:
| Method Name | Purpose |
|---|---|
| isChecked() | It returns a boolean value. When the user clicks to check the checkbox, it returns True, otherwise, it returns False. |
| setChecked() | It is used to change the state of the checkbox. True value is set to make the checkbox checked, and False value is set to make the checkbox unchecked. |
| text() | It is used to read the label of the checkbox. |
| setText() | It is used to set the label of the checkbox. |
| isTriState() | It returns a boolean value. It is used to check the tri-state to know whether the checkbox is enabled or not. |
| setTriState() | It is used to enable the third state of the checkbox that indicates the neutral state. |
Create a Form with Checkbox using QCheckBox Class:
The uses of the checkbox are shown in this section using different types of examples. The use of a single checkbox, as shown in the first example, and the use of multiple checkboxes are shown in the second example.
Example 1: Creating a Single Checkbox
The way of creating a single checkbox using QCheckBox class and reading the input value of the checkbox provided by the user are shown in this example. The necessary modules are imported at the beginning of the script. A label is used in the above checkbox for providing the information for the user. If the user clicks on the checkbox to check, then the script will print, “Wow! You like programming”, otherwise the script will print, “Oh no!, You don’t like programming”.
import sys
from PyQt5 import QtCore, QtWidgets
from PyQt5.QtWidgets import QMainWindow, QCheckBox, QLabel, QVBoxLayout, QDesktopWidget
# Define class for creating the form with single checkbox
class SingleCheckbox(QMainWindow):
def __init__(self):
super().__init__()
# Create the label text for the user
lb = QLabel("Do you like programming?", self)
lb.setGeometry(20, 20, 200, 20)
lb.move(20, 20)
# Create a checkbox with the label
cb = QCheckBox('Yes', self)
cb.stateChanged.connect(self.Check_Answer)
cb.move(20, 50)
# Set the vertical Qt Layout
vbox = QVBoxLayout()
vbox.addWidget(lb)
vbox.addWidget(cb)
# Set the window title and size
self.setWindowTitle('Form with Single Checkbox')
self.setGeometry(60, 60, 300, 100)
# Display the window in the center of the screen
win = self.frameGeometry()
pos = QDesktopWidget().availableGeometry().center()
win.moveCenter(pos)
self.move(win.topLeft())
self.show()
# Define function to check the user's input
def Check_Answer(self, state):
if state == QtCore.Qt.Checked:
print("Wow! You like programming.")
else:
print("Oh no!, You don't like programming.")
# Create app object and execute the app
app = QtWidgets.QApplication(sys.argv)
form = SingleCheckbox()
app.exec()
The following window with a checkbox will appear after executing the script.
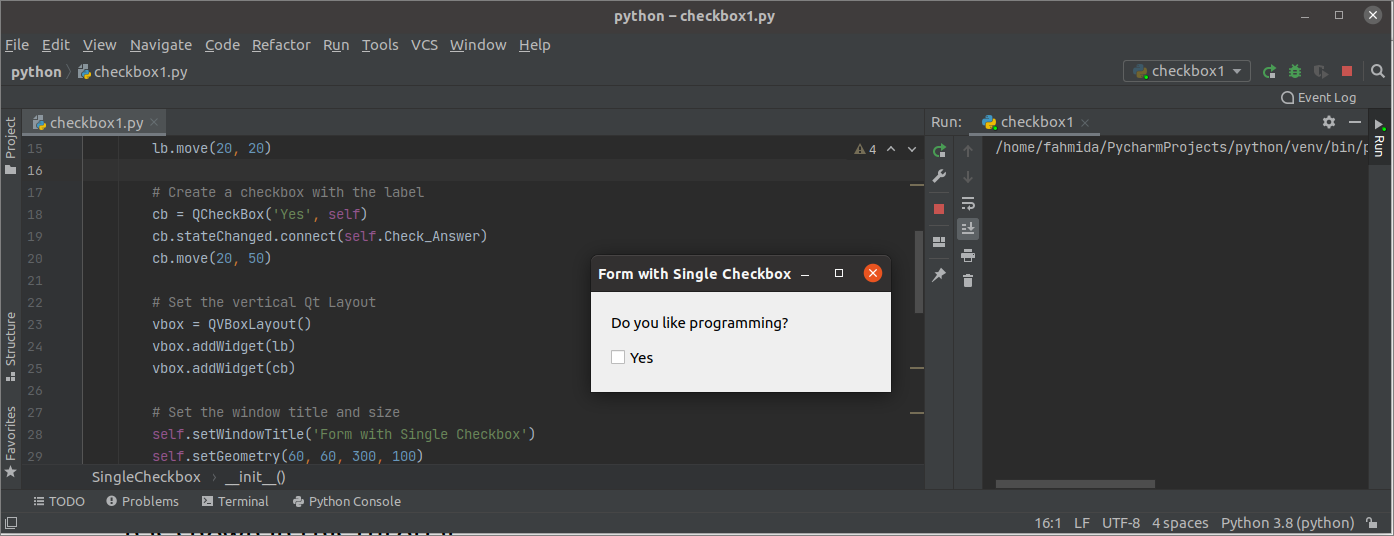
In the following output, the user has checked the checkbox twice and unchecked the checkbox once.
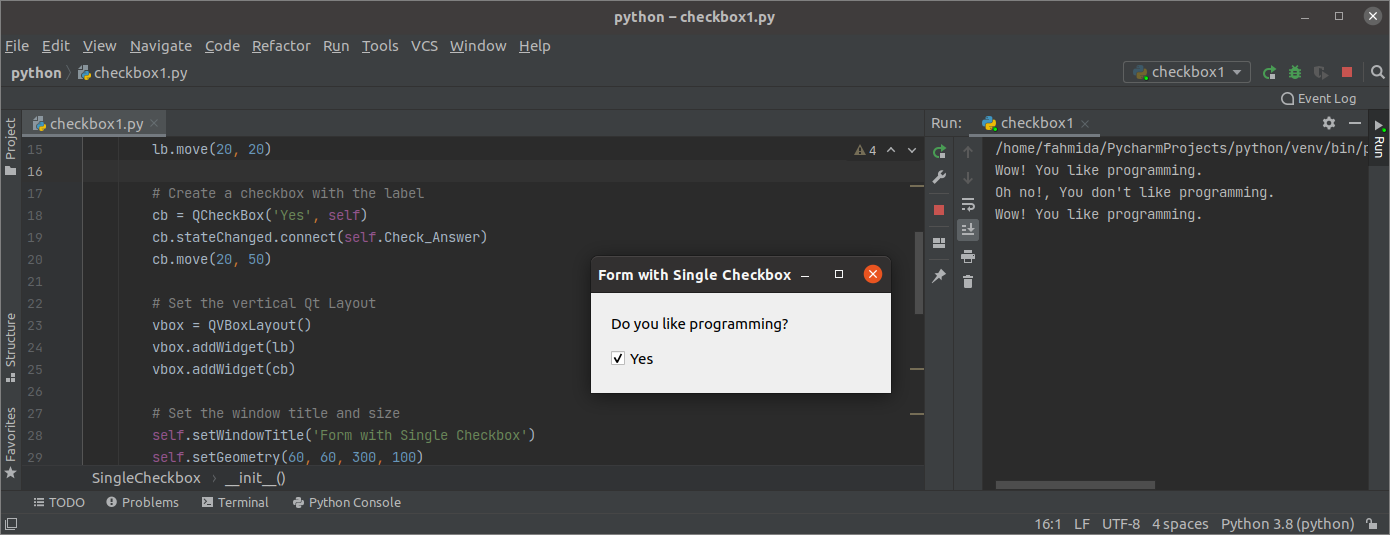
Example 2: Creating Multiple Checkboxes
The method of creating multiple checkboxes using QCheckbox class and reading multiple values of the multiple checkboxes are shown in this example. Two labels and three checkboxes are added to the window. The first label is added at the beginning of the checkboxes to provide information for the user, while the second label is added at the end of the checkboxes to display the values of the selected checkbox or checkboxes.
import sys
from PyQt5.QtWidgets import (QWidget, QCheckBox, QApplication, QVBoxLayout, QLabel, QDesktopWidget)
# Define class for creating the form with multiple checkboxes
class MultipleCheckbox(QWidget):
def __init__(self):
super().__init__()
# Set the label text for the user
lb = QLabel("Select your favorite food(s):", self)
lb.setGeometry(20, 20, 100, 20)
lb.move(20, 20)
# Create three checkboxes
cb1 = QCheckBox('Chocolate Cake', self)
cb1.move(20, 70)
cb1.stateChanged.connect(lambda: self.Selected_Value(cb1))
cb2 = QCheckBox('Ice-Cream', self)
cb2.move(20, 90)
cb2.stateChanged.connect(lambda: self.Selected_Value(cb2))
cb3 = QCheckBox('Pasta', self)
cb3.move(20, 110)
cb3.stateChanged.connect(lambda: self.Selected_Value(cb3))
self.label = QLabel('Nothing Selected')
self.label.move(20, 150)
# Set the vertical Qt Layout
vbox = QVBoxLayout()
vbox.addWidget(lb)
vbox.addWidget(cb1)
vbox.addWidget(cb2)
vbox.addWidget(cb3)
vbox.addWidget(self.label)
self.setLayout(vbox)
self.setWindowTitle('Form with Multiple Checkboxes')
self.setGeometry(60, 60, 350, 200)
self.lblText = ''
# Display the window in the center of the screen
win = self.frameGeometry()
pos = QDesktopWidget().availableGeometry().center()
win.moveCenter(pos)
self.move(win.topLeft())
self.show()
# Define function to read the user's input
def Selected_Value(self, btn):
if self.lblText != '':
str = self.lblText
strArray = str.split(' ,')
self.lblText = ''
for val in strArray:
if btn.text() != val:
if self.lblText == '':
self.lblText = val
else:
self.lblText += ' ,' + val
if btn.isChecked() == True:
if self.lblText == '':
self.lblText = btn.text()
else:
self.lblText += ' ,' + btn.text()
else:
if btn.isChecked() == True:
if self.lblText == '':
self.lblText = btn.text()
else:
self.lblText += ' ,' + btn.text()
self.label.setText('You have selected \n' + self.lblText)
# Create app object and execute the app
app = QApplication(sys.argv)
ex = MultipleCheckbox()
sys.exit(app.exec_())
The following window will appear after executing the script. The default value of the second label is “Nothing is selected” and the value of the label will be changed when any checkbox is checked or unchecked by the user.

In the following output, two checkboxes are checked by the user, and the value of the second label is changed to “Chocolate, Pasta”.
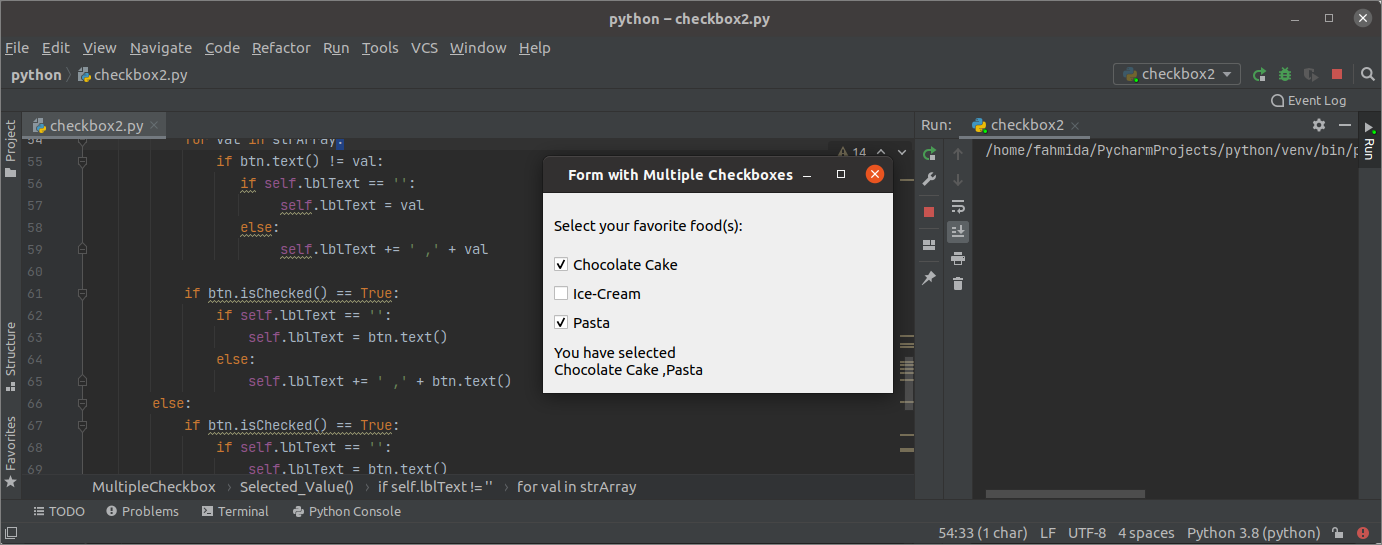
Conclusion
The way of defining one or multiple checkboxes and reading the values of the selected checkbox(es) have been explained in this tutorial using two simple examples. The groups of checkboxes can be defined to select a particular checkbox from a group that is not shown here.
]]>Python has replaced many widely used programming languages like C++ and Java, demand for programmers having Python skills is increasing very rapidly. Anyone wishes to have a decorated career in data science, and machine learning must learn Python programming language.
There are abundant resources on Python programming available online for those who wish to learn Python-like online courses and tutorials. I have already shared an article on free online Python tutorials. Now I’m going to give you a brief introduction to the top 10 Python books beginners can refer. All the books listed here are available on Amazon.
1. Head First Python: A Brain-Friendly Guide
Head First Python by Paul Barry is one of the highly-rated books on Amazon and rightly so. Paul Barry is a lecturer at the Institute of Technology, Carlow, Ireland. It is the perfect book for the beginner who wants to dive into Python programming language basics. Language of the book easy so that one can get easily comfortable in learning Python.

In the early part of the book, the author introduces you to the Python programming languages’ fundamentals and how to work with its built-in functions and data structures. And in the latter part, it slowly levels-up and introduces you to exception handling, web development, and other Python programming applications.
Ratings:
Goodreads: 3.83/5
Amazon: 4.5/5
Buy on Amazon: https://amzn.to/3crVWFz
2. Python Crash Course
Python Crash Course by Eric Matthes is the world’s best-selling guide to the Python programming language. It is one of the most sold and highly rated Python books on Amazon. Book is scripted well, and you will be programming in Python in absolutely no time.
This book will walk you through all the basics and fundamentals of Python programming and its applications. It covers Python libraries and tools that includes Pygame, Matplotlib and Django, guide to make 2D games and create/customize web apps and deploy them online.
Ratings:
Goodreads: 4.33/5
Amazon: 4.7/5
Buy on Amazon: https://amzn.to/36tJ6ml
3. Learn Python 3 The Hard Way
Don’t get scared by the book’s title as it is completely opposite world once you enter the book. Book is perfect for newbies who want to learn Python 3. The approach by the author Zed Shaw makes it easier to learn the Python programming language.

The book is full of exercises that will sharpen your skills in Python programming and its fundamentals.
Ratings:
Goodreads: 3.91/5
Amazon: 4.4/5
Buy on Amazon: https://amzn.to/36wrxlT
4. Python Cookbook
Python Cookbook by David Beazley and Brian K. Jones is an ideal Python recipe book for a beginner to intermediate level programmers. Most of the book material focuses on advanced libraries, frameworks and applications.
Before diving into this book, you must have basic knowledge of Python programming. Some of the topics covered in this book are data structure and algorithms, iterators, generators, data encoding and processing, etc.
Ratings:
Goodreads: 4.16/5
Amazon: 4.6/5
Buy on Amazon: https://amzn.to/2NKuZmc
5. Python Programming: An Introduction to Computer Science
Written by John Zelle, Python Programming: An Introduction to Computer Science gives you introduction to the Python programming and introduces you to the world of programming. The book is ideal for beginners as it eases you into the world of computer science.
As the book focuses on computer science with Python programming language at its base, this book becomes ideal for anyone who wants to step into the world of software and web development.
Ratings:
Goodreads: 4.01/5
Amazon: 4.5/5
Buy on Amazon: https://amzn.to/36wUy0y
6. Intro to Python for Computer Science and Data Science
Author Paul Deitel and Harvey Deitel offer groundbreaking and flexible approach to computer science and data science. This book is ideal for both computer science and data science aspirants.

The book contains ample exercises, examples, implementation case studies and projects. It also introduces you to programming with AI, Big data, and the cloud, along with computer science and data science. It is one of the most highly rated books on Amazon.
Ratings:
Goodreads: 4/5
Amazon: 4.6/5
Buy on Amazon: https://amzn.to/3rdZJKZ
7. Python for Beginners: 2 Books in 1
This is the collection of two books for beginners. First one is Python Programming for Beginners, and the second is Python Workbook. The second book will help you brush-up your Python skills.
This is a great combination of books for newbies who wish to learn Python programming. All the basics of Python programming are covered well in this book.
Ratings:
Goodreads: 4.62/5
Amazon: 4.3/5
Buy on Amazon: https://amzn.to/3cFFkdR
8. Python for Beginners
Python for Beginners is a Crash Coursebook by Timothy C. Needhamis that will make you learn Python programming language in one week. This book will introduce you to Python variables and directories.
This is one of the best books for beginners who want to learn Python and those newbies looking to learn to program.
Ratings:
Goodreads: 3.84/5
Amazon: 4.2/5
Buy on Amazon: https://amzn.to/2Mp1zcW
9. Python Tricks
Python Tricks: A Buffet of Awesome Python Features is a trick book by Dan Bader. This book will help you discover Python’s best practices and take you one step closer to mastering Python programming.
This book is ideal for beginner to mid-level programmers who want to learn writing clean code and make most out of Python programming. You will discover hidden gold in Python libraries while going through this book.
Ratings:
Goodreads: 4.45/5
Amazon: 4.6/5
Buy on Amazon: https://amzn.to/2NNFNQt
10. Python Workbook
Python Workbook: Learn Python in One Day and Learn It Well by Jamie Chan is Python workbook for beginners. It gives you a hands-on approach to learn Python programming fast. Book is a collection of in-depth course and practice questions to improve your Python skills.

When you finish this book, you will definitely feel confident about programming in Python language.
Ratings:
Goodreads: 3.85/5
Amazon: 4.4/5
Buy on Amazon: https://amzn.to/3tdWwwJ
These are the top 10 Python books for Python Programming Language for those beginners who want to have a career in programming and development. Feel free to share your views and queries with us at @linuxhint and @SwapTirthakar.
]]>Python NumPy library has many aggregate or statistical functions for doing different types of tasks with the one-dimensional or multi-dimensional array. Some of the useful aggregate functions are mean(), min(), max(), average(), sum(), median(), percentile(), etc. The uses of mean(), min(), and max() functions are described in this tutorial. The mean() function is used to return the arithmetic mean value of the array elements. The arithmetic mean is calculated by dividing the sum of all elements of the array by the total number of array elements. If the particular axis is mentioned in the function, then it will calculate the mean value of the particular axis. max() function is used to find out the maximum value from the array elements or the elements of the particular array axis. min() function is used to find out the minimum value from the array elements or the particular array axis.
Use of mean() function
The syntax of the mean() function is given below.
Syntax:
This function can take five arguments. The purposes of these arguments are described below:
input_array
It is a mandatory argument that takes an array as the value and the average of the array values is calculated by this function.
axis
It is an optional argument, and the value of this argument can be an integer or the tuple of integers. This argument is used for the multi-dimensional array. If the value of the axis is set to 0, then the function will calculate the mean of the column values, and if the value of the axis is set to 1, then the function will calculate the mean of the row values.
dtype
It is an optional argument that is used to define the data type of the mean value.
out
It is an optional argument and is used when the output of the function will need to store in an alternative array. In this case, the dimension of the output array must be the same as the input array. The default value of this argument is None.
keepdims
It is an optional argument, and any Boolean value can be set in this argument. It is used to transmit the output properly based on the input array.
This function returns an array of mean values if the value of the out argument is set to None, otherwise the function returns the reference to the output array.
Example: Using mean() function
The following example shows how the mean value of a one-dimensional and two-dimensional array can be calculated. Here, the first mean() function is used with a one-dimensional array of integer numbers, and the second mean() function is used with a two-dimensional array of integer numbers.
import numpy as np
# Create a one-dimensional array
np_array = np.array([6, 4, 9, 3, 1])
# Print array and mean values
print("The values of the one-dimensional NumPy array are:\n ", np_array)
print("The mean value of the one-dimensional array is:\n", np.mean(np_array))
# Create a two-dimensional array
np_array = np.array([[5, 3, 5], [5, 4, 3]])
# Print array and mean values
print("\nThe values of the two-dimensional NumPy array are:\n ", np_array)
print("The mean values of the two-dimensional array are:\n", np.mean(np_array, axis=0))
Output:
The following output will appear after executing the above script.
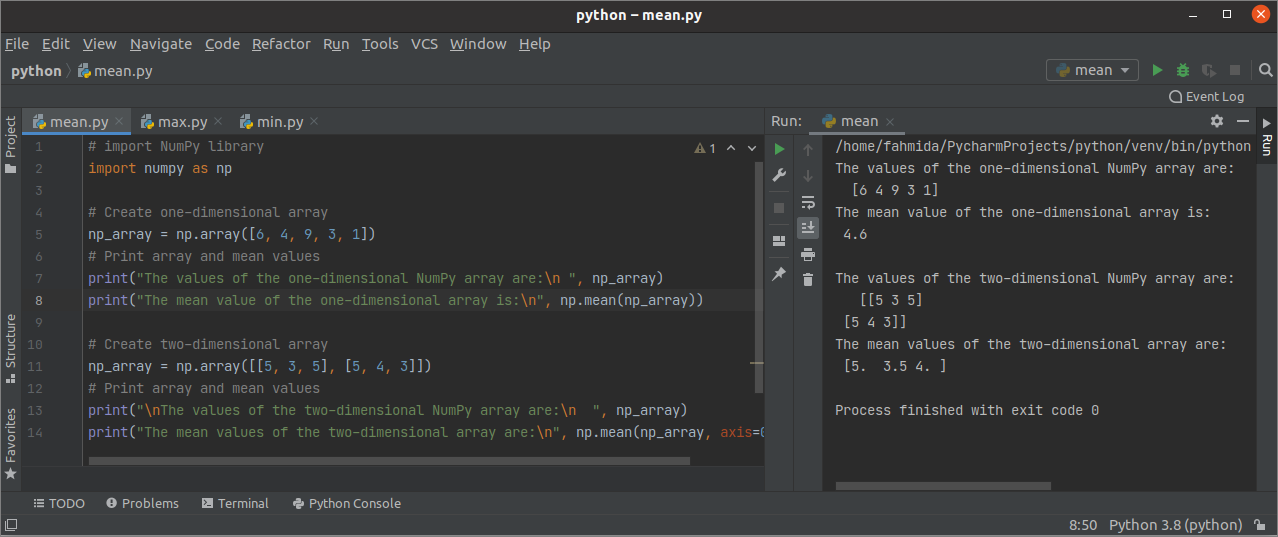
Use of max() function
The syntax of the max() function is given below.
Syntax:
This function can take six arguments. The purposes of these arguments are described below:
input_array
It is a mandatory argument that takes an array as the value, and this function finds out the maximum value of the array.
axis
It is an optional argument, and its value can be an integer or the tuple of integers. This argument is used for the multi-dimensional array.
out
It is an optional argument and is used when the output of the function will need to store in an alternative array.
keepdims
It is an optional argument, and any Boolean value can be set in this argument. It is used to transmit the output properly based on the input array.
initial
It is an optional argument that is used to set the minimum value of the output.
where
It is an optional argument that is used to compare the array elements to find out the maximum value. The default value of this argument is None.
This function returns the maximum value for the one-dimensional array or an array of the maximum values for the multi-dimensional array.
Example: Using max() function
The following example shows the use of the max() function to find out the maximum value of a one-dimensional array.
import numpy as np
# Create NumPy array of integers
np_array = np.array([21, 5, 34, 12, 30, 6])
# Find the maximum value from the array
max_value = np.max(np_array)
# Print the maximum value
print('The maximum value of the array is: ', max_value)
Output:
The following output will appear after executing the above script.

Use of min() function
The syntax of the min() function is given below.
Syntax:
The purposes of the arguments of this function are the same as the max() function that has been explained in the part of the max() function. This returns the minimum value of the input array.
Example: Using min() function
The following example shows the use of the min() function to find out the minimum value of a one-dimensional array.
import numpy as np
# Create NumPy array of integers
np_array = np.array([21, 5, 34, 12, 30, 6])
# Find the maximum value from the array
max_value = np.max(np_array)
# Print the maximum value
print('The maximum value of the array is: ', max_value)
Output:
The following output will appear after executing the above script.

Conclusion
The purposes of three useful aggregate functions (mean(), max(), and min()) have been explained in this tutorial to help the readers to know the ways of using these functions in python script.
]]>Syntax:
where the () function can take two arguments. The first argument is mandatory, and the second argument is optional. If the value of the first argument (condition) is true, then the output will contain the array elements from the array, x otherwise from the array, y. This function will return the index values of the input array if no optional argument is used.
Use of where() function:
Different types of Boolean operators can be used to define the condition of this function. The uses of where a () function with multiple conditions are shown in this part of the tutorial.
Example -1: Use of multiple conditions with logical OR
The following example shows the use of the where() function with and without the optional argument. Here, the logical OR has used to define the condition. The first where() function has applied in a one-dimensional array that will return the array of indices of the input array where the condition will return True. The second where() function has applied in two one-dimensional arrays will retrieve the values from the first array when the condition will return True. Otherwise, it will retrieve the values from the second array.
import numpy as np
# Create an array using the list
np_array1 = np.array([23, 11, 45, 43, 60, 18, 33, 71, 52, 38])
print("The values of the input array :\n", np_array1)
# Create another array based on the multiple conditions and one array
new_array1 = np.where((np_array1 50))
# Print the new array
print("The filtered values of the array :\n", new_array1)
# Create an array using range values
np_array2 = np.arange(40, 50)
# Create another array based on the multiple conditions and two arrays
new_array2 = np.where((np_array1 60), np_array1, np_array2)
# Print the new array
print("The filtered values of the array :\n", new_array2)
Output:
The following output will appear after executing the above script. Here, the condition has returned True for the values 23,11,18,33, and 38 of the first array. The condition has returned False for the values 45, 43, 60, 71, and 52. So, 42, 43, 44, and 48 have been added from the second array for the values 45, 43, 60, and 52. Here, 71 is out of range.

Example -2: Use of multiple conditions with logical AND
The following example shows how the () function can be used with the multiple conditions defined by logical and applied in two one-dimensional arrays. Here, two one-dimensional NumPy arrays have been created by using the rand() function. These arrays have been used in the where() function with the multiple conditions to create the new array based on the conditions. The condition will return True when the first array’s value is less than 40 and the value of the second array is greater than 60. The new array has printed later.
import numpy as np
# Create two arrays of random values
np_array1 = np.random.rand(10)*100
np_array2 = np.random.rand(10)*100
# Print the array values
print("\nThe values of the first array :\n", np_array1)
print("\nThe values of the second array :\n", np_array2)
# Create a new array based on the conditions
new_array = np.where((np_array1 60), np_array1, np_array2)
# Print the new array
print("\nThe filtered values of both arrays :\n", new_array)
Output:
The following output will appear after executing the above script. The condition has returned False for all elements. So, the returned array contains the values from the second array only.

Example-3: Use of multiple conditions in the multi-dimensional array
The following example shows how where the () function can be used with the multiple conditions defined by logical AND that will be applied in two multi-dimensional arrays. Here, two multi-dimensional arrays have been created by using lists. Next, these functions have applied in where() function to create the new array based on the condition. The condition used in the function will return True where the value of the first array is even and the value of the second array is odd; otherwise, the condition will return False.
import numpy as np
# Create two multidimensional arrays of integer values
np_array1 = np.array([[5, 12, 21, 6, 11], [6, 10, 15, 31, 8]])
np_array2 = np.array([[43, 19, 7, 34, 9], [99, 22, 41, 5, 12]])
# Print the array values
print("\nThe values of the first array :\n", np_array1)
print("\nThe values of the second array :\n", np_array2)
# Create a new array from two arrays based on the conditions
new_array = np.where(((np_array1 % 2 == 0) & (np_array2 % 2 == 1)), np_array1, np_array2)
# Print the new array
print("\nThe filtered values of both arrays :\n", new_array)
Output:
The following output will appear after executing the above script. In the output, 43, 12, 7, 34, 9, 22, 41, 5, and 12 have added in the new array from the second array because the condition is False for these values. The first 12 value in the new array has added from the first array because the condition is True for this value only.

Conclusion:
where the () function of the NumPy library is useful for filtering the values from two arrays. Creating a new array by filtering the data from two arrays based on multiple conditions defined by logical OR and logical AND has been explained in this tutorial. I hope the readers will be able to use this function in their script properly after practicing the examples of this tutorial.
]]>