When it comes to performing such tasks, the Linux kernel provides features such as ptrace to debug and diagnose processes.
This article discusses how to use the strace tool to trace, monitor, and debug processes interacting with the Kernel.
What Are System Calls?
Before we discuss how to use strace, you need to understand what we are looking for and how they work. That means we should l go over the basics of Linux System calls.
A system call is a programmatic method through which a program can request a service from the system’s Kernel. That is the process we will use to inspect the actions between user processes and the Linux kernel.
Anytime a user executes a program that makes a read, write, kill, exit, bind, etc., request, they are making a system call. There is a wide range of system calls used by programs to perform various tasks such as networking, reading and writing to files, initializing and terminating processes, and much more.
Think of system calls as functions—they behave similarly—because they can accept arguments and return values. The main difference between system calls and normal operation is that system calls can directly interact with the Kernel. System calls use a trap mechanism to navigate between user space and the Kernel.
In the Linux system, this mechanism is well hidden from the users by libraries such as Glibc.
NOTE: There is a lot more to system calls and kernel interactions than what we’ve discussed in this tutorial. Please refer to the manual pages for more information.
How to Install strace on Linux
Although strace tools don’t come pre-installed by default in major Linux distributions, it is available in most official repositories of these distributions; you can install it easily using default package managers.
NOTE: Although we won’t cover how to install strace on all systems, we’ll discuss how to do so with major package managers such as apt, dnf, pacman, and yum
1: Debian (apt) Installation
Install strace using the command:
2: RedHat Family (dnf and yum)
To install strace using yum package manager, enter the command:
For dnf package manager, enter the command:
3: Arch Linux (pacman)
For Arch Linux users, you can install strace with the command:
Now that you have strace installed and running, we can move on and learn how to use
Basic Strace Usage: A How-to Guide
Let’s discuss basic strace usage and understand the basic output of the command and how we can use it.
NOTE: Strace output such as system calls names, corresponding arguments, and return values get handled by the standard error file descriptor (stderr).
The basic way to use strace is by calling the strace utility followed by the program’s name, whose behavior we want to understand.
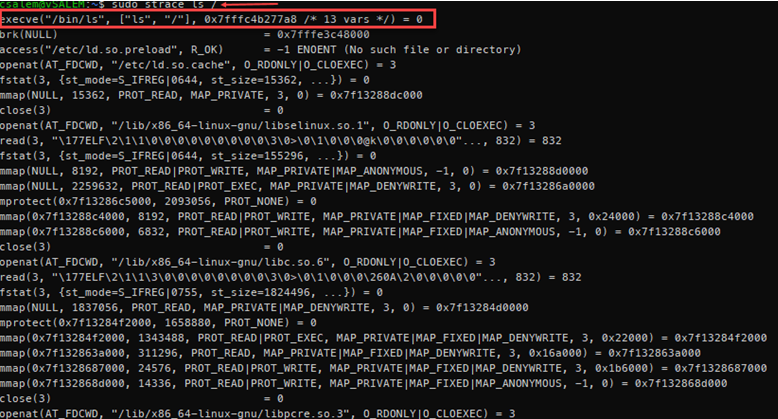
Here’s an example of that using the ls command:
Wow! That is a lot of output for a simple command such as ls.
Although we cannot discuss all the output from the strace command, we can distill and understand its meaning.
If you consider the first line in the output above, you will notice the following features.
- The name of the system call
- The arguments passed to the system call enclosed in parenthesis.
- The return value from the system call
Hence, in the first line, the system call is execve (execute program using the specified array of arguments), the arguments of the system call are (“/bin/ls”, [“ls”, “/”], 0x7fffc4b277a8 /* 13 vars */) and a return value of 0.
The execve system calls execute the binary we want to use, in this case, located in (/bin/ls) and the array of arguments being the path we want to list contents.
You will also notice a notation enclosed with a forward slash and an asterisk. For our example:
The above output indicates the number of variables added as a result of calling the process. The environment inside the execv function is accessed by using the environ external variable defined as:
The final output is the return value, which is 0 in this case.
You’ll also notice that most lines of the strace output follow a similar pattern we discussed above.
How to Trace Specific System calls
Although strace gives a lot of information regarding programs system calls, most instances will call on you to filter specific system calls. To do this, we pass the -e flag to the strace command followed by the name of the system call we need.
How about looking at the read system calls for the ls command. For example:
You will notice that this only displays only read system calls.
The read system call accepts three arguments: file descriptor, buffer, and the number of bytes. The system call then reads up to the count bytes from the passed file descriptor argument into the buffer.
Summary of System Calls
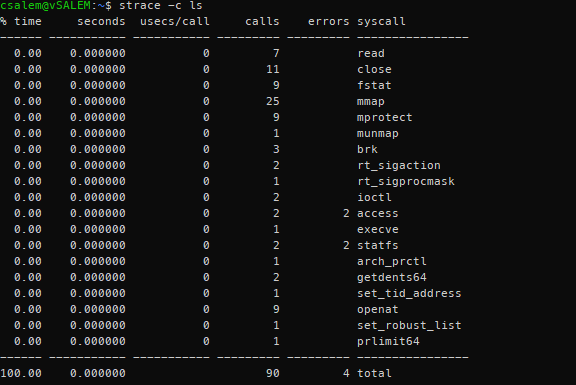
Strace also allows us to get a summary of system calls made by a process. By passing the -c or –summary-only argument, we can get an output such as the one shown below:
The command filters and arranges the output more efficiently than the normal strace output. To get both summary and normal strace output, pass the -C argument.
How To Use Strace With Running Processes
At other times, you will need a trace of a running process. Up to this point, we have only used strace a single command. To trace a running process, we can use the -p argument followed by the Process ID (PID) process to attach strace to it.
You can get the PID of a running process by using the top and grep, ps, htop, pidof, or other system monitoring tools.
For example, to get the PID of the apache process, we can use:
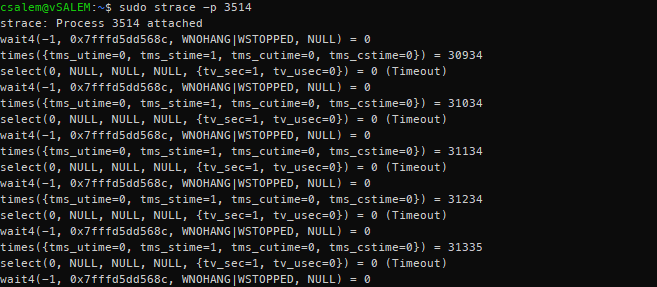
That should give you the PID of the apache2 process (PID 3514 in this case), and we can use it to attach it to strace.
That should display an output similar to the one shown below.
Strace will continuously trace the attached process and show output as the attached process executes system calls. To terminate the trace, press CTRL + C, which detaches the process from the strace.
How to Save Strace Output to Files
We can also redirect the output of strace to a file as an argument. Using the -o flag followed by the file path as an argument, we can save strace logs.
For example:
Once the file is saved, you can later monitor and analyze it.
Conclusion
In this guide, we learned how to install and use strace on Major Linux distributions. Now that you understand system calls and how processes work, you can use strace to monitor and debug a running system process running.
The concepts learned in this tutorial are very useful, mainly because you can use what you’ve learned to monitor if anyone is tampering with system processes.


